|
Download Data (XLS File) |
|
||||||||
|
||||||||
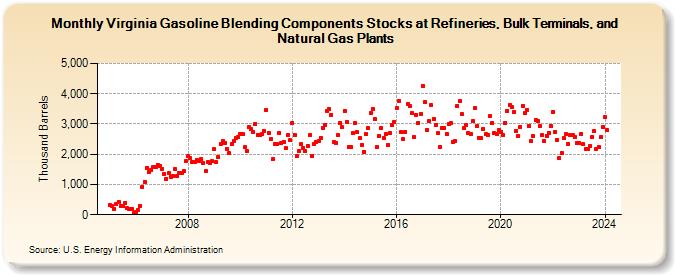
| Virginia Gasoline Blending Components Stocks at Refineries, Bulk Terminals, and Natural Gas Plants (Thousand Barrels) | ||||||||
| Year | Jan | Feb | Mar | Apr | May | Jun | Jul | Aug | Sep | Oct | Nov | Dec |
|---|---|---|---|---|---|---|---|---|---|---|---|---|
| 2005 | 312 | 289 | 196 | 348 | 415 | 277 | 298 | 403 | 212 | 194 | 204 | 64 |
| 2006 | 96 | 150 | 295 | 927 | 1,094 | 1,556 | 1,413 | 1,478 | 1,586 | 1,577 | 1,642 | 1,627 |
| 2007 | 1,523 | 1,342 | 1,189 | 1,369 | 1,248 | 1,288 | 1,519 | 1,267 | 1,390 | 1,373 | 1,445 | 1,769 |
| 2008 | 1,939 | 1,860 | 1,734 | 1,744 | 1,817 | 1,792 | 1,830 | 1,713 | 1,429 | 1,732 | 1,726 | 1,767 |
| 2009 | 2,158 | 1,742 | 1,906 | 2,340 | 2,432 | 2,383 | 2,182 | 2,029 | 2,335 | 2,429 | 2,533 | 2,553 |
| 2010 | 2,655 | 2,675 | 2,229 | 2,119 | 2,906 | 2,832 | 2,725 | 3,006 | 2,648 | 2,649 | 2,661 | 2,758 |
| 2011 | 3,466 | 2,718 | 2,496 | 1,830 | 2,347 | 2,327 | 2,698 | 2,360 | 2,415 | 2,197 | 2,620 | 2,459 |
| 2012 | 3,047 | 2,652 | 1,928 | 2,107 | 2,325 | 2,205 | 2,112 | 2,265 | 2,631 | 1,956 | 2,322 | 2,405 |
| 2013 | 2,438 | 2,546 | 2,874 | 2,967 | 3,423 | 3,480 | 3,312 | 2,409 | 2,385 | 2,623 | 3,036 | 2,890 |
| 2014 | 3,435 | 3,069 | 2,251 | 2,223 | 2,690 | 3,039 | 2,721 | 2,524 | 2,320 | 2,084 | 2,659 | 2,856 |
| 2015 | 3,378 | 3,487 | 3,159 | 2,247 | 2,615 | 2,872 | 2,550 | 2,665 | 2,313 | 2,695 | 2,965 | 3,074 |
| 2016 | 3,536 | 3,769 | 2,719 | 2,499 | 2,724 | 3,657 | 3,589 | 3,353 | 2,576 | 3,308 | 3,041 | 3,318 |
| 2017 | 4,262 | 3,721 | 2,798 | 3,086 | 3,612 | 3,166 | 2,950 | 2,692 | 2,240 | 2,876 | 2,853 | 2,668 |
| 2018 | 2,998 | 3,023 | 2,420 | 2,422 | 3,591 | 3,747 | 3,321 | 2,871 | 2,968 | 2,699 | 2,670 | 3,097 |
| 2019 | 3,521 | 2,931 | 2,547 | 2,522 | 2,841 | 2,657 | 2,649 | 3,253 | 3,043 | 2,702 | 2,685 | 2,793 |
| 2020 | 2,744 | 2,629 | 3,047 | 3,435 | 3,624 | 3,555 | 3,410 | 2,781 | 2,595 | 2,916 | 3,607 | 3,368 |
| 2021 | 3,467 | 2,948 | 2,429 | 2,593 | 3,117 | 3,105 | 2,926 | 2,619 | 2,437 | 2,618 | 2,714 | 2,926 |
| 2022 | 3,411 | 2,741 | 2,480 | 1,870 | 2,036 | 2,522 | 2,664 | 2,349 | 2,621 | 2,628 | 2,569 | 2,358 |
| 2023 | 2,368 | 2,684 | 2,328 | 2,174 | 2,180 | 2,277 | 2,572 | 2,764 | 2,178 | 2,241 | 2,562 | 2,906 |
| 2024 | 3,219 | |||||||||||
| - = No Data Reported; -- = Not Applicable; NA = Not Available; W = Withheld to avoid disclosure of individual company data. |
| Release Date: 3/29/2024 |
| Next Release Date: 4/30/2024 |