|
Download Data (XLS File) |
|
||||||||
|
||||||||
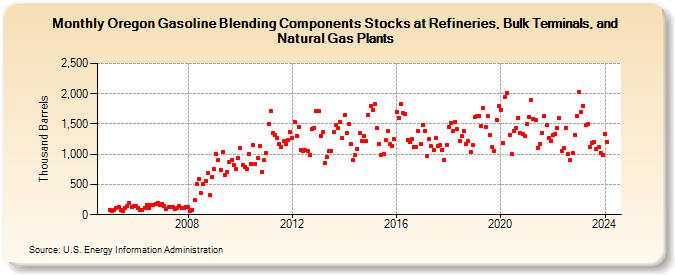
| Oregon Gasoline Blending Components Stocks at Refineries, Bulk Terminals, and Natural Gas Plants (Thousand Barrels) | ||||||||
| Year | Jan | Feb | Mar | Apr | May | Jun | Jul | Aug | Sep | Oct | Nov | Dec |
|---|---|---|---|---|---|---|---|---|---|---|---|---|
| 2005 | 84 | 57 | 86 | 115 | 135 | 78 | 56 | 119 | 148 | 190 | 129 | 143 |
| 2006 | 146 | 107 | 74 | 75 | 109 | 154 | 103 | 167 | 157 | 183 | 193 | 155 |
| 2007 | 176 | 142 | 101 | 124 | 134 | 132 | 88 | 107 | 137 | 107 | 105 | 131 |
| 2008 | 121 | 63 | 82 | 239 | 500 | 595 | 353 | 507 | 556 | 691 | 325 | 616 |
| 2009 | 750 | 996 | 912 | 741 | 1,044 | 662 | 709 | 864 | 903 | 820 | 748 | 935 |
| 2010 | 1,100 | 823 | 785 | 758 | 1,001 | 843 | 1,152 | 843 | 936 | 1,132 | 706 | 900 |
| 2011 | 1,027 | 1,497 | 1,707 | 1,349 | 1,324 | 1,275 | 1,177 | 1,125 | 1,222 | 1,162 | 1,233 | 1,374 |
| 2012 | 1,265 | 1,538 | 1,303 | 1,452 | 1,064 | 1,059 | 1,065 | 1,045 | 994 | 1,417 | 1,439 | 1,722 |
| 2013 | 1,714 | 1,308 | 1,362 | 855 | 948 | 1,048 | 1,058 | 1,364 | 1,478 | 1,426 | 1,537 | 1,271 |
| 2014 | 1,647 | 1,353 | 1,496 | 1,166 | 898 | 980 | 1,092 | 1,350 | 1,216 | 1,299 | 1,218 | 1,651 |
| 2015 | 1,793 | 1,731 | 1,823 | 1,430 | 1,167 | 990 | 1,002 | 1,234 | 1,379 | 1,172 | 1,139 | 1,246 |
| 2016 | 1,700 | 1,602 | 1,828 | 1,689 | 1,672 | 1,242 | 1,198 | 1,246 | 1,117 | 1,117 | 1,386 | 1,162 |
| 2017 | 1,491 | 1,389 | 972 | 1,248 | 1,131 | 1,066 | 1,264 | 1,129 | 1,147 | 1,075 | 910 | 1,155 |
| 2018 | 1,457 | 1,517 | 1,382 | 1,540 | 1,420 | 1,222 | 1,302 | 1,383 | 1,164 | 1,213 | 1,044 | 1,146 |
| 2019 | 1,610 | 1,635 | 1,631 | 1,465 | 1,756 | 1,442 | 1,634 | 1,316 | 1,126 | 1,045 | 1,570 | 1,799 |
| 2020 | 1,737 | 1,182 | 1,951 | 2,019 | 1,324 | 1,003 | 1,376 | 1,440 | 1,597 | 1,349 | 1,335 | 1,305 |
| 2021 | 1,501 | 1,620 | 1,895 | 1,589 | 1,561 | 1,108 | 1,176 | 1,354 | 1,639 | 1,481 | 1,269 | 1,214 |
| 2022 | 1,321 | 1,335 | 1,429 | 1,599 | 1,061 | 1,097 | 1,426 | 1,000 | 910 | 1,021 | 1,317 | 1,633 |
| 2023 | 2,034 | 1,699 | 1,802 | 1,484 | 1,496 | 1,119 | 1,190 | 1,198 | 1,085 | 1,118 | 1,024 | 991 |
| 2024 | 1,335 | |||||||||||
| - = No Data Reported; -- = Not Applicable; NA = Not Available; W = Withheld to avoid disclosure of individual company data. |
| Release Date: 3/29/2024 |
| Next Release Date: 4/30/2024 |