|
Download Data (XLS File) |
|
||||||||
|
||||||||
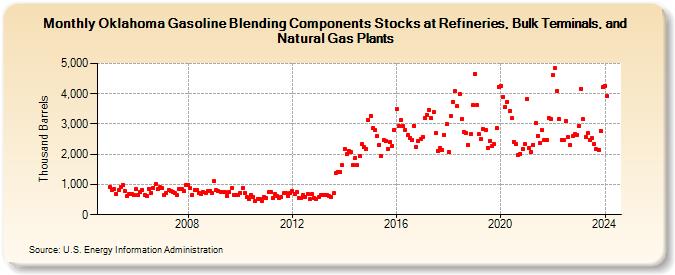
| Oklahoma Gasoline Blending Components Stocks at Refineries, Bulk Terminals, and Natural Gas Plants (Thousand Barrels) | ||||||||
| Year | Jan | Feb | Mar | Apr | May | Jun | Jul | Aug | Sep | Oct | Nov | Dec |
|---|---|---|---|---|---|---|---|---|---|---|---|---|
| 2005 | 915 | 830 | 837 | 701 | 824 | 924 | 993 | 772 | 615 | 678 | 685 | 652 |
| 2006 | 838 | 668 | 749 | 829 | 666 | 635 | 864 | 726 | 891 | 1,012 | 835 | 904 |
| 2007 | 884 | 665 | 720 | 814 | 782 | 745 | 702 | 636 | 860 | 864 | 788 | 967 |
| 2008 | 996 | 870 | 665 | 827 | 823 | 730 | 698 | 766 | 722 | 776 | 790 | 722 |
| 2009 | 1,104 | 810 | 784 | 759 | 757 | 738 | 619 | 757 | 873 | 652 | 656 | 650 |
| 2010 | 725 | 890 | 723 | 575 | 511 | 667 | 601 | 469 | 520 | 512 | 467 | 582 |
| 2011 | 558 | 752 | 763 | 552 | 684 | 620 | 560 | 573 | 705 | 716 | 608 | 708 |
| 2012 | 768 | 682 | 750 | 559 | 569 | 648 | 599 | 680 | 511 | 673 | 555 | 535 |
| 2013 | 571 | 656 | 652 | 639 | 659 | 608 | 588 | 704 | 1,379 | 1,414 | 1,416 | 1,633 |
| 2014 | 2,169 | 1,994 | 2,118 | 2,073 | 1,639 | 1,886 | 1,634 | 1,931 | 2,333 | 2,243 | 2,180 | 3,122 |
| 2015 | 3,277 | 2,853 | 2,808 | 2,605 | 2,315 | 1,935 | 2,457 | 2,439 | 2,170 | 2,417 | 2,284 | 2,811 |
| 2016 | 3,482 | 2,920 | 3,134 | 2,941 | 2,812 | 2,622 | 2,530 | 2,481 | 2,944 | 2,234 | 2,428 | 2,496 |
| 2017 | 2,585 | 3,201 | 3,298 | 3,473 | 3,192 | 3,398 | 2,700 | 2,103 | 2,215 | 2,137 | 2,647 | 3,001 |
| 2018 | 2,071 | 3,265 | 3,724 | 4,078 | 3,580 | 3,995 | 3,175 | 2,735 | 2,699 | 2,320 | 2,658 | 3,618 |
| 2019 | 4,665 | 3,633 | 2,660 | 2,498 | 2,830 | 2,804 | 2,219 | 2,453 | 2,278 | 2,332 | 2,865 | 4,216 |
| 2020 | 4,265 | 3,898 | 3,571 | 3,738 | 3,416 | 3,185 | 2,420 | 2,327 | 1,978 | 2,019 | 2,175 | 2,328 |
| 2021 | 3,810 | 2,216 | 2,079 | 2,318 | 3,031 | 2,613 | 2,375 | 2,808 | 2,465 | 2,478 | 3,202 | 3,158 |
| 2022 | 4,627 | 4,837 | 4,095 | 3,154 | 2,472 | 2,457 | 3,113 | 2,563 | 2,304 | 2,587 | 2,667 | 2,648 |
| 2023 | 2,949 | 4,169 | 3,150 | 2,573 | 2,687 | 2,474 | 2,525 | 2,325 | 2,165 | 2,124 | 2,783 | 4,220 |
| 2024 | 4,266 | |||||||||||
| - = No Data Reported; -- = Not Applicable; NA = Not Available; W = Withheld to avoid disclosure of individual company data. |
| Release Date: 3/29/2024 |
| Next Release Date: 4/30/2024 |