|
Download Data (XLS File) |
|
||||||||
|
||||||||
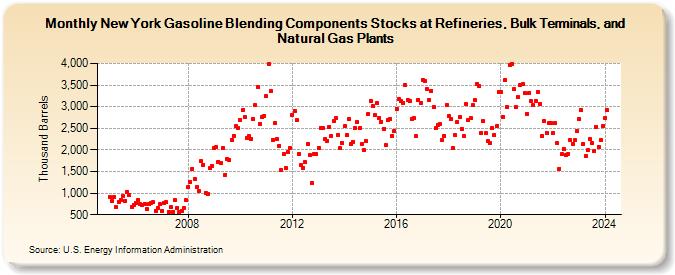
| New York Gasoline Blending Components Stocks at Refineries, Bulk Terminals, and Natural Gas Plants (Thousand Barrels) | ||||||||
| Year | Jan | Feb | Mar | Apr | May | Jun | Jul | Aug | Sep | Oct | Nov | Dec |
|---|---|---|---|---|---|---|---|---|---|---|---|---|
| 2005 | 901 | 822 | 915 | 681 | 797 | 847 | 929 | 827 | 1,026 | 950 | 688 | 732 |
| 2006 | 775 | 842 | 737 | 726 | 759 | 626 | 747 | 761 | 786 | 596 | 652 | 739 |
| 2007 | 597 | 777 | 788 | 565 | 667 | 572 | 835 | 655 | 574 | 592 | 645 | 835 |
| 2008 | 1,151 | 1,262 | 1,566 | 1,333 | 1,143 | 1,046 | 1,743 | 1,656 | 1,004 | 988 | 1,571 | 1,628 |
| 2009 | 2,036 | 2,061 | 1,729 | 1,690 | 2,044 | 1,428 | 1,792 | 1,772 | 2,228 | 2,328 | 2,552 | 2,509 |
| 2010 | 2,690 | 2,914 | 2,760 | 2,279 | 2,325 | 2,263 | 2,718 | 3,039 | 3,451 | 2,588 | 2,757 | 2,785 |
| 2011 | 3,237 | 3,985 | 3,354 | 2,231 | 2,634 | 2,247 | 2,096 | 1,532 | 1,907 | 1,588 | 1,949 | 2,049 |
| 2012 | 2,817 | 2,898 | 2,686 | 1,916 | 1,640 | 1,588 | 1,713 | 2,137 | 1,881 | 1,233 | 1,899 | 1,902 |
| 2013 | 2,054 | 2,516 | 2,502 | 2,252 | 2,213 | 2,539 | 2,324 | 2,661 | 2,740 | 2,356 | 2,035 | 2,163 |
| 2014 | 2,542 | 2,339 | 2,714 | 2,135 | 2,190 | 2,510 | 2,646 | 2,507 | 2,146 | 1,991 | 2,201 | 2,826 |
| 2015 | 3,141 | 3,017 | 2,800 | 3,077 | 2,746 | 2,653 | 2,492 | 2,107 | 2,689 | 2,723 | 2,330 | 2,436 |
| 2016 | 2,956 | 3,169 | 3,122 | 3,096 | 3,501 | 3,159 | 3,131 | 2,722 | 2,738 | 2,315 | 3,150 | 3,093 |
| 2017 | 3,626 | 3,598 | 3,408 | 3,160 | 3,374 | 2,997 | 2,498 | 2,583 | 2,593 | 2,223 | 2,323 | 3,043 |
| 2018 | 2,781 | 2,705 | 2,047 | 2,337 | 2,649 | 2,762 | 2,494 | 2,323 | 3,057 | 2,691 | 2,731 | 3,035 |
| 2019 | 3,153 | 3,530 | 3,469 | 2,389 | 2,664 | 2,380 | 2,196 | 2,151 | 2,498 | 2,350 | 2,547 | 3,331 |
| 2020 | 3,342 | 2,764 | 3,620 | 2,989 | 3,969 | 3,996 | 3,398 | 2,987 | 3,216 | 3,507 | 3,527 | 3,308 |
| 2021 | 2,833 | 3,320 | 3,123 | 3,033 | 3,128 | 3,343 | 3,069 | 2,321 | 2,666 | 2,402 | 2,615 | 2,626 |
| 2022 | 2,390 | 2,617 | 2,152 | 1,569 | 1,901 | 2,029 | 1,873 | 1,911 | 2,221 | 2,137 | 2,219 | 2,436 |
| 2023 | 2,711 | 2,922 | 2,133 | 1,851 | 1,991 | 2,243 | 2,153 | 1,969 | 2,540 | 2,074 | 2,227 | 2,549 |
| 2024 | 2,729 | |||||||||||
| - = No Data Reported; -- = Not Applicable; NA = Not Available; W = Withheld to avoid disclosure of individual company data. |
| Release Date: 3/29/2024 |
| Next Release Date: 4/30/2024 |