|
Download Data (XLS File) |
|
||||||||
|
||||||||
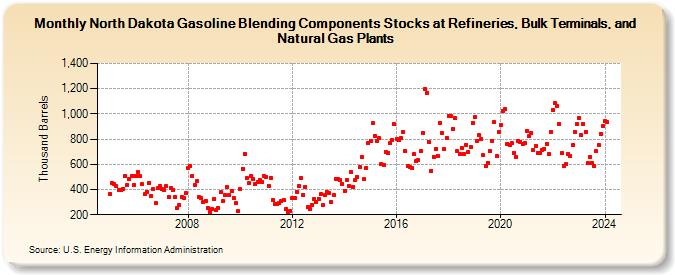
| North Dakota Gasoline Blending Components Stocks at Refineries, Bulk Terminals, and Natural Gas Plants (Thousand Barrels) | ||||||||
| Year | Jan | Feb | Mar | Apr | May | Jun | Jul | Aug | Sep | Oct | Nov | Dec |
|---|---|---|---|---|---|---|---|---|---|---|---|---|
| 2005 | 368 | 453 | 440 | 425 | 400 | 400 | 408 | 505 | 434 | 483 | 506 | 437 |
| 2006 | 511 | 538 | 505 | 441 | 362 | 381 | 455 | 351 | 404 | 289 | 409 | 429 |
| 2007 | 402 | 395 | 425 | 340 | 414 | 399 | 343 | 257 | 277 | 341 | 335 | 370 |
| 2008 | 573 | 585 | 506 | 437 | 464 | 344 | 331 | 297 | 312 | 256 | 224 | 243 |
| 2009 | 328 | 237 | 253 | 378 | 305 | 354 | 418 | 354 | 386 | 336 | 292 | 227 |
| 2010 | 403 | 566 | 684 | 493 | 451 | 510 | 484 | 440 | 458 | 476 | 459 | 506 |
| 2011 | 500 | 430 | 494 | 318 | 284 | 283 | 296 | 308 | 318 | 246 | 224 | 228 |
| 2012 | 329 | 330 | 383 | 425 | 493 | 360 | 420 | 261 | 249 | 280 | 323 | 302 |
| 2013 | 327 | 362 | 277 | 357 | 384 | 370 | 302 | 353 | 487 | 481 | 473 | 442 |
| 2014 | 392 | 475 | 429 | 536 | 422 | 474 | 498 | 578 | 657 | 481 | 572 | 766 |
| 2015 | 788 | 929 | 827 | 786 | 810 | 601 | 594 | 700 | 691 | 767 | 794 | 916 |
| 2016 | 802 | 794 | 805 | 857 | 709 | 587 | 581 | 571 | 678 | 623 | 632 | 702 |
| 2017 | 849 | 1,201 | 1,169 | 776 | 549 | 660 | 725 | 667 | 928 | 847 | 722 | 812 |
| 2018 | 986 | 981 | 882 | 967 | 703 | 684 | 732 | 682 | 756 | 694 | 739 | 929 |
| 2019 | 975 | 787 | 832 | 798 | 670 | 585 | 614 | 704 | 788 | 934 | 664 | 859 |
| 2020 | 911 | 1,024 | 1,035 | 764 | 756 | 766 | 691 | 661 | 785 | 778 | 759 | 766 |
| 2021 | 867 | 822 | 850 | 711 | 749 | 692 | 690 | 710 | 722 | 761 | 683 | 859 |
| 2022 | 1,034 | 1,084 | 1,062 | 919 | 688 | 588 | 599 | 681 | 668 | 751 | 860 | 919 |
| 2023 | 969 | 832 | 922 | 858 | 607 | 659 | 610 | 585 | 702 | 755 | 842 | 906 |
| 2024 | 941 | |||||||||||
| - = No Data Reported; -- = Not Applicable; NA = Not Available; W = Withheld to avoid disclosure of individual company data. |
| Release Date: 3/29/2024 |
| Next Release Date: 4/30/2024 |