|
Download Data (XLS File) |
|
||||||||
|
||||||||
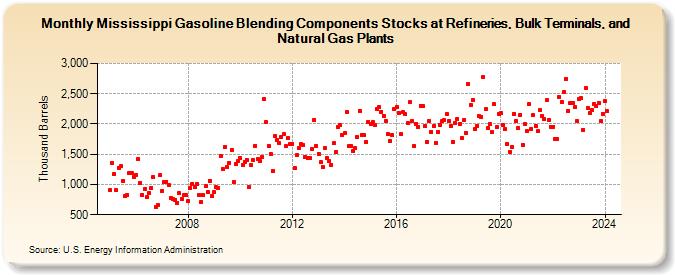
| Mississippi Gasoline Blending Components Stocks at Refineries, Bulk Terminals, and Natural Gas Plants (Thousand Barrels) | ||||||||
| Year | Jan | Feb | Mar | Apr | May | Jun | Jul | Aug | Sep | Oct | Nov | Dec |
|---|---|---|---|---|---|---|---|---|---|---|---|---|
| 2005 | 910 | 1,358 | 1,166 | 901 | 1,279 | 1,301 | 1,064 | 811 | 825 | 1,188 | 1,185 | 1,126 |
| 2006 | 1,160 | 1,424 | 1,027 | 829 | 927 | 786 | 861 | 947 | 1,126 | 623 | 663 | 1,155 |
| 2007 | 892 | 1,047 | 1,046 | 987 | 782 | 759 | 749 | 699 | 852 | 761 | 819 | 826 |
| 2008 | 730 | 944 | 1,014 | 965 | 1,005 | 828 | 710 | 821 | 967 | 876 | 1,062 | 806 |
| 2009 | 872 | 951 | 949 | 1,466 | 1,259 | 1,622 | 1,289 | 1,361 | 1,575 | 1,040 | 1,336 | 1,391 |
| 2010 | 1,430 | 1,330 | 1,375 | 1,409 | 955 | 1,321 | 1,397 | 1,643 | 1,420 | 1,384 | 1,451 | 2,406 |
| 2011 | 2,025 | 1,642 | 1,502 | 1,226 | 1,801 | 1,734 | 1,678 | 1,791 | 1,833 | 1,634 | 1,772 | 1,672 |
| 2012 | 1,676 | 1,273 | 1,486 | 1,601 | 1,676 | 1,660 | 1,447 | 1,433 | 1,432 | 1,586 | 2,071 | 1,636 |
| 2013 | 1,509 | 1,365 | 1,281 | 1,598 | 1,432 | 1,386 | 1,324 | 1,680 | 1,540 | 1,954 | 1,976 | 1,817 |
| 2014 | 1,845 | 2,201 | 1,635 | 1,634 | 1,554 | 1,596 | 1,778 | 2,218 | 1,820 | 1,818 | 1,702 | 2,037 |
| 2015 | 2,007 | 2,025 | 1,987 | 2,250 | 2,274 | 2,205 | 2,139 | 2,053 | 1,834 | 1,713 | 1,818 | 2,250 |
| 2016 | 2,286 | 2,182 | 1,833 | 2,194 | 2,158 | 2,013 | 2,357 | 2,048 | 1,638 | 2,002 | 1,958 | 2,304 |
| 2017 | 2,295 | 1,966 | 1,704 | 2,053 | 1,868 | 1,967 | 1,692 | 1,868 | 1,989 | 2,048 | 2,069 | 2,166 |
| 2018 | 2,053 | 1,973 | 1,710 | 2,021 | 2,083 | 2,004 | 1,775 | 2,070 | 1,857 | 2,658 | 2,315 | 2,398 |
| 2019 | 1,917 | 1,973 | 2,134 | 2,120 | 2,773 | 2,242 | 1,929 | 1,996 | 1,869 | 2,322 | 1,953 | 2,168 |
| 2020 | 2,181 | 1,981 | 1,913 | 1,673 | 1,537 | 1,621 | 2,165 | 2,047 | 1,938 | 2,154 | 1,657 | 2,003 |
| 2021 | 1,877 | 2,324 | 1,921 | 2,147 | 1,962 | 1,878 | 2,226 | 2,133 | 2,075 | 2,391 | 2,064 | 1,956 |
| 2022 | 1,955 | 1,752 | 1,752 | 2,446 | 2,364 | 2,527 | 2,749 | 2,221 | 2,342 | 2,348 | 2,275 | 2,041 |
| 2023 | 2,420 | 2,423 | 1,907 | 2,597 | 2,262 | 2,189 | 2,230 | 2,338 | 2,297 | 2,353 | 2,047 | 2,173 |
| 2024 | 2,375 | |||||||||||
| - = No Data Reported; -- = Not Applicable; NA = Not Available; W = Withheld to avoid disclosure of individual company data. |
| Release Date: 3/29/2024 |
| Next Release Date: 4/30/2024 |