|
Download Data (XLS File) |
|
||||||||
|
||||||||
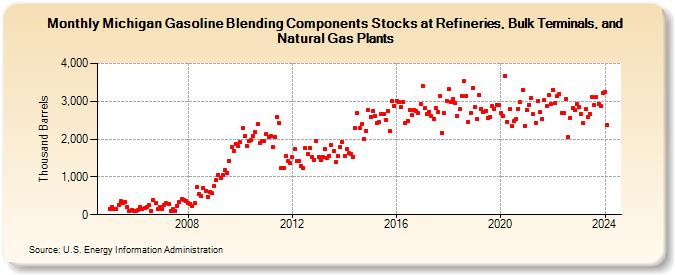
| Michigan Gasoline Blending Components Stocks at Refineries, Bulk Terminals, and Natural Gas Plants (Thousand Barrels) | ||||||||
| Year | Jan | Feb | Mar | Apr | May | Jun | Jul | Aug | Sep | Oct | Nov | Dec |
|---|---|---|---|---|---|---|---|---|---|---|---|---|
| 2005 | 161 | 210 | 163 | 142 | 254 | 369 | 302 | 338 | 201 | 86 | 125 | 103 |
| 2006 | 99 | 117 | 203 | 152 | 177 | 200 | 248 | 94 | 382 | 301 | 147 | 207 |
| 2007 | 153 | 265 | 299 | 290 | 108 | 145 | 106 | 231 | 334 | 413 | 391 | 351 |
| 2008 | 309 | 286 | 240 | 305 | 730 | 548 | 496 | 698 | 639 | 473 | 589 | 567 |
| 2009 | 758 | 909 | 1,040 | 962 | 1,043 | 1,189 | 1,110 | 1,432 | 1,779 | 1,690 | 1,864 | 1,808 |
| 2010 | 1,916 | 2,287 | 2,069 | 1,818 | 1,956 | 1,965 | 2,078 | 2,196 | 2,393 | 1,901 | 1,950 | 1,937 |
| 2011 | 2,145 | 2,054 | 2,092 | 1,790 | 2,051 | 2,588 | 2,421 | 1,237 | 1,236 | 1,556 | 1,413 | 1,369 |
| 2012 | 1,529 | 1,725 | 1,433 | 1,420 | 1,283 | 1,238 | 1,757 | 1,607 | 1,758 | 1,535 | 1,459 | 1,942 |
| 2013 | 1,537 | 1,448 | 1,519 | 1,749 | 1,490 | 1,565 | 1,841 | 1,676 | 1,407 | 1,564 | 1,795 | 1,912 |
| 2014 | 1,566 | 1,743 | 1,626 | 1,605 | 1,536 | 2,289 | 2,686 | 2,281 | 2,405 | 1,991 | 2,224 | 2,776 |
| 2015 | 2,596 | 2,739 | 2,621 | 2,417 | 2,444 | 2,671 | 2,655 | 2,507 | 2,754 | 2,207 | 2,995 | 2,886 |
| 2016 | 3,020 | 2,971 | 2,849 | 2,986 | 2,436 | 2,479 | 2,774 | 2,644 | 2,763 | 2,730 | 2,681 | 2,916 |
| 2017 | 3,407 | 2,818 | 2,661 | 2,724 | 2,624 | 2,539 | 2,810 | 2,716 | 3,131 | 2,163 | 2,687 | 3,017 |
| 2018 | 3,319 | 2,969 | 3,070 | 2,964 | 2,617 | 2,802 | 3,137 | 3,533 | 3,141 | 2,451 | 2,698 | 3,353 |
| 2019 | 2,853 | 2,532 | 3,174 | 2,791 | 2,707 | 2,752 | 2,558 | 2,596 | 2,878 | 2,808 | 2,907 | 2,909 |
| 2020 | 2,696 | 2,610 | 3,677 | 2,461 | 2,787 | 2,349 | 2,470 | 2,519 | 2,803 | 2,970 | 3,308 | 2,347 |
| 2021 | 2,779 | 2,904 | 3,081 | 2,654 | 2,428 | 3,006 | 2,705 | 2,521 | 3,033 | 2,865 | 3,158 | 2,917 |
| 2022 | 3,309 | 2,953 | 3,150 | 3,193 | 2,703 | 2,694 | 3,058 | 2,059 | 2,570 | 2,829 | 2,760 | 2,931 |
| 2023 | 2,853 | 2,664 | 2,418 | 2,789 | 2,577 | 2,670 | 3,126 | 2,894 | 3,115 | 2,940 | 2,867 | 3,223 |
| 2024 | 3,254 | |||||||||||
| - = No Data Reported; -- = Not Applicable; NA = Not Available; W = Withheld to avoid disclosure of individual company data. |
| Release Date: 3/29/2024 |
| Next Release Date: 4/30/2024 |