|
Download Data (XLS File) |
|
||||||||
|
||||||||
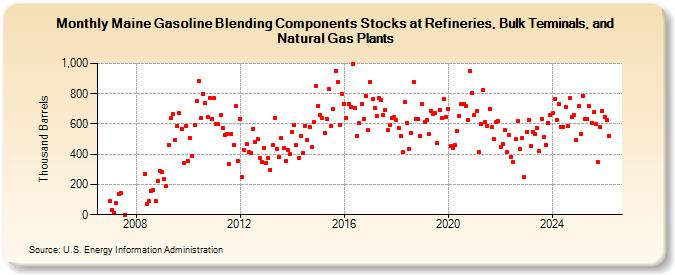
| Maine Gasoline Blending Components Stocks at Refineries, Bulk Terminals, and Natural Gas Plants (Thousand Barrels) | ||||||||
| Year | Jan | Feb | Mar | Apr | May | Jun | Jul | Aug | Sep | Oct | Nov | Dec |
|---|---|---|---|---|---|---|---|---|---|---|---|---|
| 2007 | 88 | 30 | 13 | 77 | 138 | 143 | 1 | |||||
| 2008 | 272 | 71 | 89 | 154 | 163 | 89 | 222 | 290 | ||||
| 2009 | 282 | 239 | 189 | 462 | 637 | 666 | 493 | 586 | 672 | 567 | 340 | 587 |
| 2010 | 354 | 504 | 388 | 593 | 751 | 883 | 639 | 800 | 741 | 643 | 769 | 634 |
| 2011 | 771 | 597 | 597 | 657 | 575 | 525 | 536 | 336 | 534 | 460 | 716 | 354 |
| 2012 | 635 | 247 | 428 | 466 | 412 | 406 | 569 | 483 | 500 | 377 | 349 | 444 |
| 2013 | 344 | 374 | 297 | 458 | 640 | 435 | 379 | 507 | 442 | 356 | 425 | 399 |
| 2014 | 549 | 591 | 460 | 376 | 520 | 408 | 585 | 495 | 580 | 448 | 610 | 849 |
| 2015 | 721 | 659 | 641 | 542 | 635 | 830 | 587 | 701 | 951 | 880 | 595 | 801 |
| 2016 | 730 | 639 | 731 | 715 | 994 | 707 | 521 | 607 | 731 | 630 | 785 | 559 |
| 2017 | 878 | 762 | 706 | 656 | 773 | 756 | 661 | 692 | 562 | 591 | 637 | 644 |
| 2018 | 623 | 572 | 520 | 413 | 743 | 604 | 433 | 543 | 879 | 630 | 631 | 519 |
| 2019 | 731 | 610 | 624 | 532 | 686 | 669 | 672 | 473 | 690 | 641 | 765 | 647 |
| 2020 | 702 | 453 | 440 | 462 | 552 | 656 | 731 | 732 | 717 | 629 | 948 | 808 |
| 2021 | 657 | 689 | 414 | 602 | 826 | 610 | 588 | 702 | 577 | 500 | 614 | 619 |
| 2022 | 449 | 466 | 560 | 414 | 527 | 380 | 350 | 498 | 617 | 437 | 506 | 248 |
| 2023 | 524 | 431 | 457 | 547 | 532 | 573 | 418 | 632 | 513 | 462 | 607 | 661 |
| 2024 | 671 | |||||||||||
| - = No Data Reported; -- = Not Applicable; NA = Not Available; W = Withheld to avoid disclosure of individual company data. |
| Release Date: 3/29/2024 |
| Next Release Date: 4/30/2024 |