|
Download Data (XLS File) |
|
||||||||
|
||||||||
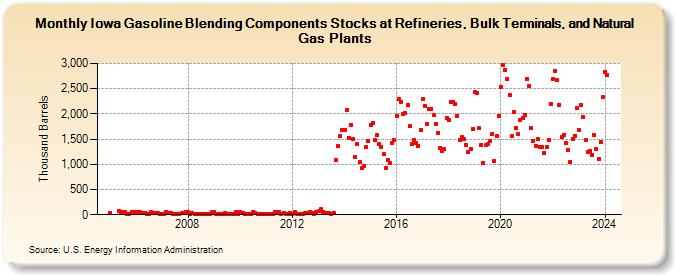
| Iowa Gasoline Blending Components Stocks at Refineries, Bulk Terminals, and Natural Gas Plants (Thousand Barrels) | ||||||||
| Year | Jan | Feb | Mar | Apr | May | Jun | Jul | Aug | Sep | Oct | Nov | Dec |
|---|---|---|---|---|---|---|---|---|---|---|---|---|
| 2005 | 38 | 72 | 59 | 51 | 60 | 6 | 12 | 57 | 45 | |||
| 2006 | 56 | 54 | 50 | 25 | 36 | 21 | 23 | 55 | 28 | 33 | 37 | 9 |
| 2007 | 6 | 9 | 59 | 27 | 25 | 7 | 15 | 8 | 8 | 29 | 41 | 57 |
| 2008 | 52 | 14 | 35 | 7 | 7 | 18 | 15 | 5 | 8 | 7 | 21 | 49 |
| 2009 | 58 | 10 | 21 | 5 | 9 | 41 | 24 | 19 | 7 | 14 | 61 | 7 |
| 2010 | 46 | 40 | 21 | 7 | 13 | 19 | 59 | 43 | 11 | 15 | 9 | 11 |
| 2011 | 11 | 13 | 24 | 16 | 46 | 58 | 60 | 22 | 27 | 15 | 23 | 28 |
| 2012 | 17 | 57 | 23 | 23 | 22 | 20 | 32 | 25 | 44 | 31 | 20 | 45 |
| 2013 | 74 | 104 | 58 | 27 | 38 | 27 | 21 | 43 | 1,077 | 1,363 | 1,554 | 1,672 |
| 2014 | 1,687 | 2,070 | 1,530 | 1,786 | 1,501 | 1,137 | 1,405 | 1,038 | 923 | 958 | 1,340 | 1,453 |
| 2015 | 1,777 | 1,820 | 1,476 | 1,575 | 1,403 | 1,348 | 1,203 | 923 | 1,093 | 1,017 | 1,429 | 1,481 |
| 2016 | 1,951 | 2,289 | 2,237 | 2,007 | 2,008 | 2,176 | 1,759 | 1,400 | 1,479 | 1,415 | 1,368 | 1,684 |
| 2017 | 2,305 | 2,158 | 1,807 | 2,090 | 2,106 | 1,970 | 1,805 | 1,620 | 1,329 | 1,270 | 1,301 | 1,914 |
| 2018 | 1,881 | 2,234 | 2,234 | 2,202 | 1,966 | 1,478 | 1,539 | 1,500 | 1,383 | 1,244 | 1,297 | 1,708 |
| 2019 | 2,436 | 2,410 | 1,712 | 1,389 | 1,023 | 1,375 | 1,397 | 1,465 | 1,599 | 1,056 | 1,564 | 1,954 |
| 2020 | 2,539 | 2,976 | 2,878 | 2,688 | 2,377 | 1,570 | 2,038 | 1,724 | 1,610 | 1,875 | 1,913 | 1,974 |
| 2021 | 2,699 | 2,562 | 1,713 | 1,471 | 1,365 | 1,494 | 1,349 | 1,344 | 1,217 | 1,352 | 1,480 | 2,198 |
| 2022 | 2,699 | 2,841 | 2,663 | 2,185 | 1,542 | 1,574 | 1,423 | 1,281 | 1,048 | 1,507 | 1,568 | 2,114 |
| 2023 | 1,685 | 2,170 | 1,932 | 1,482 | 1,252 | 1,264 | 1,193 | 1,578 | 1,296 | 1,102 | 1,434 | 2,338 |
| 2024 | 2,832 | |||||||||||
| - = No Data Reported; -- = Not Applicable; NA = Not Available; W = Withheld to avoid disclosure of individual company data. |
| Release Date: 3/29/2024 |
| Next Release Date: 4/30/2024 |