|
Download Data (XLS File) |
|
||||||||
|
||||||||
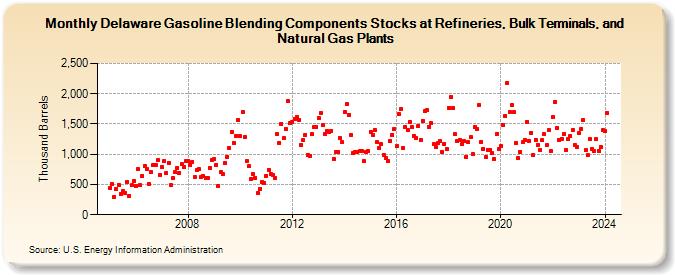
| Delaware Gasoline Blending Components Stocks at Refineries, Bulk Terminals, and Natural Gas Plants (Thousand Barrels) | ||||||||
| Year | Jan | Feb | Mar | Apr | May | Jun | Jul | Aug | Sep | Oct | Nov | Dec |
|---|---|---|---|---|---|---|---|---|---|---|---|---|
| 2005 | 447 | 506 | 297 | 427 | 494 | 350 | 390 | 363 | 543 | 315 | 486 | 556 |
| 2006 | 476 | 755 | 485 | 645 | 803 | 759 | 514 | 704 | 823 | 828 | 905 | 662 |
| 2007 | 794 | 885 | 689 | 862 | 491 | 602 | 699 | 780 | 695 | 833 | 795 | 887 |
| 2008 | 894 | 829 | 875 | 629 | 733 | 753 | 629 | 648 | 603 | 613 | 776 | 912 |
| 2009 | 923 | 830 | 482 | 699 | 666 | 850 | 959 | 1,097 | 1,373 | 1,187 | 1,307 | 1,571 |
| 2010 | 1,297 | 1,700 | 1,283 | 887 | 800 | 598 | 668 | 615 | 361 | 429 | 533 | 530 |
| 2011 | 645 | 740 | 681 | 664 | 614 | 1,330 | 1,191 | 1,504 | 1,263 | 1,420 | 1,874 | 1,516 |
| 2012 | 1,539 | 1,583 | 1,622 | 1,569 | 1,158 | 1,239 | 1,321 | 993 | 977 | 1,327 | 1,451 | 1,447 |
| 2013 | 1,600 | 1,685 | 1,476 | 1,338 | 1,386 | 1,362 | 1,389 | 928 | 1,032 | 1,040 | 1,262 | 1,199 |
| 2014 | 1,698 | 1,822 | 1,655 | 1,323 | 1,013 | 1,030 | 1,038 | 1,046 | 1,046 | 884 | 1,040 | 1,047 |
| 2015 | 1,374 | 1,326 | 1,399 | 1,196 | 1,106 | 1,161 | 993 | 945 | 891 | 1,222 | 1,325 | 1,413 |
| 2016 | 1,136 | 1,661 | 1,743 | 1,109 | 1,453 | 1,401 | 1,539 | 1,450 | 1,299 | 1,264 | 1,473 | 1,236 |
| 2017 | 1,553 | 1,710 | 1,730 | 1,458 | 1,509 | 1,166 | 1,119 | 1,181 | 1,212 | 1,042 | 1,175 | 1,085 |
| 2018 | 1,768 | 1,943 | 1,756 | 1,331 | 1,222 | 1,237 | 1,172 | 1,211 | 962 | 1,194 | 1,279 | 997 |
| 2019 | 1,450 | 1,420 | 1,817 | 1,202 | 1,090 | 955 | 1,076 | 1,070 | 1,016 | 920 | 1,332 | 1,079 |
| 2020 | 1,136 | 1,489 | 1,633 | 2,183 | 1,701 | 1,811 | 1,694 | 1,188 | 937 | 1,042 | 1,197 | 1,236 |
| 2021 | 1,537 | 1,217 | 1,358 | 983 | 1,240 | 1,158 | 1,076 | 1,230 | 1,331 | 1,148 | 1,394 | 1,053 |
| 2022 | 1,615 | 1,868 | 1,437 | 1,239 | 1,256 | 1,335 | 1,066 | 1,250 | 1,304 | 1,394 | 1,154 | 1,123 |
| 2023 | 1,346 | 1,423 | 1,569 | 1,065 | 981 | 1,248 | 1,093 | 1,052 | 1,246 | 1,053 | 1,114 | 1,394 |
| 2024 | 1,379 | |||||||||||
| - = No Data Reported; -- = Not Applicable; NA = Not Available; W = Withheld to avoid disclosure of individual company data. |
| Release Date: 3/29/2024 |
| Next Release Date: 4/30/2024 |