|
Download Data (XLS File) |
|
||||||||
|
||||||||
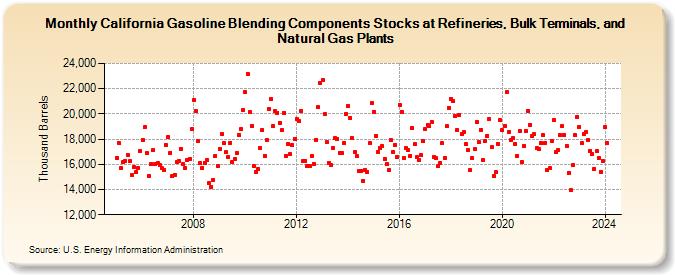
| California Gasoline Blending Components Stocks at Refineries, Bulk Terminals, and Natural Gas Plants (Thousand Barrels) | ||||||||
| Year | Jan | Feb | Mar | Apr | May | Jun | Jul | Aug | Sep | Oct | Nov | Dec |
|---|---|---|---|---|---|---|---|---|---|---|---|---|
| 2005 | 16,513 | 17,666 | 15,688 | 16,158 | 16,285 | 16,768 | 16,226 | 15,135 | 15,782 | 15,364 | 15,741 | 17,028 |
| 2006 | 17,927 | 18,922 | 16,866 | 15,100 | 15,985 | 17,126 | 16,026 | 16,070 | 15,928 | 15,673 | 15,548 | 17,536 |
| 2007 | 18,175 | 16,925 | 15,069 | 15,172 | 16,188 | 16,244 | 17,236 | 15,994 | 15,736 | 16,365 | 16,403 | 18,791 |
| 2008 | 21,088 | 20,193 | 17,854 | 16,074 | 15,697 | 16,130 | 16,315 | 14,511 | 14,219 | 14,765 | 16,689 | 15,871 |
| 2009 | 17,192 | 18,414 | 17,678 | 16,946 | 16,562 | 17,715 | 16,150 | 16,394 | 16,879 | 18,288 | 18,809 | 20,279 |
| 2010 | 21,703 | 23,197 | 20,163 | 19,024 | 15,840 | 15,423 | 15,639 | 17,268 | 18,737 | 16,661 | 17,947 | 20,399 |
| 2011 | 21,199 | 19,001 | 20,217 | 20,098 | 19,298 | 18,724 | 20,104 | 16,688 | 17,647 | 16,795 | 17,517 | 18,012 |
| 2012 | 19,608 | 19,409 | 20,240 | 16,278 | 16,282 | 15,835 | 15,872 | 16,672 | 16,051 | 17,923 | 20,531 | 22,458 |
| 2013 | 22,681 | 19,990 | 17,758 | 16,116 | 15,957 | 17,324 | 18,051 | 18,010 | 16,918 | 16,890 | 17,675 | 20,005 |
| 2014 | 20,654 | 19,678 | 18,085 | 16,939 | 16,649 | 15,491 | 15,486 | 14,699 | 15,525 | 15,387 | 17,681 | 20,841 |
| 2015 | 20,163 | 18,283 | 17,001 | 17,279 | 17,456 | 16,432 | 16,006 | 15,574 | 17,922 | 16,964 | 17,536 | 16,578 |
| 2016 | 20,731 | 20,178 | 16,518 | 17,254 | 17,119 | 16,663 | 18,885 | 17,579 | 16,540 | 16,316 | 16,723 | 17,818 |
| 2017 | 18,808 | 19,124 | 19,014 | 19,368 | 16,594 | 16,468 | 15,832 | 16,088 | 17,660 | 16,484 | 19,014 | 20,471 |
| 2018 | 21,177 | 20,997 | 19,872 | 18,704 | 19,896 | 18,380 | 18,553 | 17,623 | 17,150 | 15,555 | 16,481 | 17,175 |
| 2019 | 19,364 | 17,765 | 18,740 | 16,314 | 17,888 | 18,269 | 19,594 | 17,350 | 15,108 | 15,364 | 17,635 | 19,477 |
| 2020 | 18,692 | 19,039 | 21,706 | 18,571 | 17,890 | 18,063 | 17,623 | 16,687 | 18,641 | 16,202 | 17,453 | 18,673 |
| 2021 | 20,259 | 19,140 | 18,274 | 18,367 | 17,265 | 17,194 | 17,728 | 18,324 | 17,704 | 15,512 | 15,686 | 17,888 |
| 2022 | 19,552 | 16,964 | 17,120 | 18,335 | 19,013 | 18,331 | 17,472 | 15,333 | 13,953 | 15,948 | 18,292 | 19,781 |
| 2023 | 18,994 | 17,662 | 18,411 | 18,560 | 17,910 | 17,094 | 16,787 | 15,637 | 17,028 | 16,497 | 15,427 | 16,231 |
| 2024 | 18,932 | 17,684 | ||||||||||
| - = No Data Reported; -- = Not Applicable; NA = Not Available; W = Withheld to avoid disclosure of individual company data. |
| Release Date: 4/30/2024 |
| Next Release Date: 5/31/2024 |