|
Download Data (XLS File) |
|
||||||||
|
||||||||
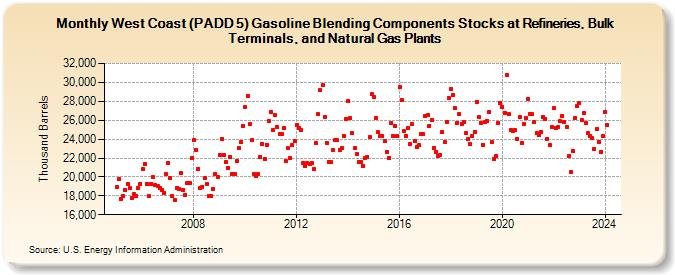
| West Coast (PADD 5) Gasoline Blending Components Stocks at Refineries, Bulk Terminals, and Natural Gas Plants (Thousand Barrels) | ||||||||
| Year | Jan | Feb | Mar | Apr | May | Jun | Jul | Aug | Sep | Oct | Nov | Dec |
|---|---|---|---|---|---|---|---|---|---|---|---|---|
| 2005 | 18,985 | 19,737 | 17,654 | 17,981 | 18,659 | 19,237 | 18,814 | 17,756 | 18,140 | 17,936 | 18,806 | 19,297 |
| 2006 | 20,872 | 21,409 | 19,285 | 17,966 | 19,285 | 19,960 | 19,140 | 19,002 | 18,775 | 18,591 | 18,246 | 20,267 |
| 2007 | 21,453 | 19,870 | 17,974 | 17,556 | 18,869 | 18,772 | 20,391 | 18,637 | 18,135 | 19,337 | 19,331 | 21,986 |
| 2008 | 23,933 | 22,887 | 20,846 | 18,860 | 18,959 | 19,837 | 19,272 | 18,015 | 17,968 | 18,736 | 20,351 | 19,996 |
| 2009 | 22,335 | 24,057 | 22,338 | 21,566 | 20,986 | 22,098 | 20,292 | 20,307 | 21,654 | 23,028 | 23,707 | 25,417 |
| 2010 | 27,392 | 28,544 | 25,600 | 23,877 | 20,340 | 20,077 | 20,285 | 22,119 | 23,485 | 21,946 | 23,412 | 25,879 |
| 2011 | 26,871 | 25,005 | 26,520 | 25,286 | 24,536 | 24,584 | 25,138 | 21,647 | 23,009 | 21,990 | 23,345 | 23,757 |
| 2012 | 25,533 | 25,177 | 25,008 | 21,495 | 21,147 | 21,505 | 21,392 | 21,435 | 20,816 | 23,542 | 26,611 | 29,180 |
| 2013 | 29,673 | 26,344 | 23,594 | 21,602 | 21,560 | 22,878 | 23,856 | 23,854 | 22,873 | 23,012 | 24,379 | 26,167 |
| 2014 | 28,000 | 26,180 | 24,652 | 23,012 | 22,384 | 21,575 | 21,552 | 21,197 | 22,043 | 22,145 | 24,185 | 28,731 |
| 2015 | 28,452 | 26,245 | 24,703 | 24,323 | 24,349 | 23,791 | 22,636 | 22,003 | 25,731 | 24,333 | 25,352 | 24,307 |
| 2016 | 29,464 | 28,173 | 24,826 | 24,369 | 25,172 | 23,484 | 25,581 | 23,783 | 23,170 | 23,342 | 24,535 | 24,500 |
| 2017 | 26,440 | 26,510 | 25,415 | 26,020 | 23,091 | 22,687 | 22,230 | 22,327 | 24,749 | 23,653 | 25,805 | 28,327 |
| 2018 | 29,280 | 28,700 | 27,239 | 25,717 | 26,657 | 25,629 | 25,827 | 24,609 | 24,018 | 23,470 | 24,312 | 24,799 |
| 2019 | 27,966 | 26,291 | 25,749 | 23,380 | 25,772 | 25,919 | 26,892 | 23,718 | 21,943 | 22,208 | 25,735 | 27,830 |
| 2020 | 27,383 | 26,762 | 30,811 | 26,618 | 24,969 | 24,858 | 24,926 | 24,054 | 26,288 | 23,635 | 25,554 | 26,227 |
| 2021 | 28,231 | 26,618 | 26,622 | 25,802 | 24,640 | 24,393 | 24,788 | 26,359 | 26,153 | 24,047 | 23,364 | 25,241 |
| 2022 | 27,252 | 25,179 | 25,236 | 25,868 | 26,486 | 25,828 | 25,302 | 22,220 | 20,565 | 22,762 | 26,202 | 27,520 |
| 2023 | 27,786 | 25,999 | 26,759 | 25,713 | 24,631 | 24,344 | 24,071 | 22,987 | 25,056 | 23,743 | 22,686 | 24,278 |
| 2024 | 26,848 | |||||||||||
| - = No Data Reported; -- = Not Applicable; NA = Not Available; W = Withheld to avoid disclosure of individual company data. |
| Release Date: 3/29/2024 |
| Next Release Date: 4/30/2024 |