|
Download Data (XLS File) |
|
||||||||
|
||||||||
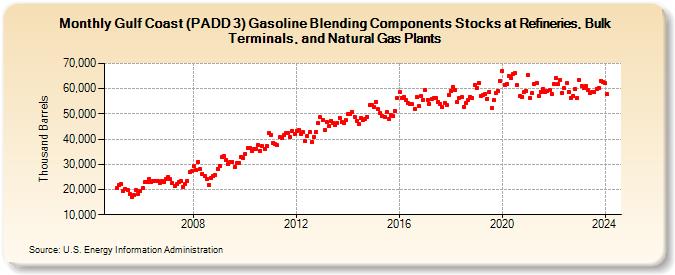
| Gulf Coast (PADD 3) Gasoline Blending Components Stocks at Refineries, Bulk Terminals, and Natural Gas Plants (Thousand Barrels) | ||||||||
| Year | Jan | Feb | Mar | Apr | May | Jun | Jul | Aug | Sep | Oct | Nov | Dec |
|---|---|---|---|---|---|---|---|---|---|---|---|---|
| 2005 | 20,617 | 21,742 | 22,140 | 19,220 | 20,391 | 19,988 | 18,200 | 17,146 | 17,715 | 19,731 | 18,366 | 19,303 |
| 2006 | 20,479 | 22,875 | 22,928 | 24,208 | 22,924 | 23,284 | 23,386 | 23,448 | 22,574 | 23,346 | 22,955 | 24,357 |
| 2007 | 24,966 | 24,056 | 22,498 | 21,557 | 21,993 | 22,807 | 23,221 | 20,949 | 22,132 | 23,570 | 26,760 | 27,166 |
| 2008 | 29,132 | 27,565 | 31,080 | 28,046 | 26,194 | 25,534 | 24,160 | 21,843 | 24,728 | 25,382 | 25,821 | 28,243 |
| 2009 | 29,430 | 32,738 | 33,345 | 31,874 | 29,978 | 31,112 | 30,962 | 28,890 | 30,597 | 30,475 | 33,050 | 32,672 |
| 2010 | 34,267 | 36,289 | 36,446 | 35,186 | 36,072 | 36,252 | 37,820 | 35,454 | 37,144 | 36,104 | 37,365 | 42,467 |
| 2011 | 41,710 | 38,587 | 37,894 | 37,474 | 40,657 | 40,247 | 41,464 | 42,320 | 42,412 | 40,639 | 43,360 | 42,124 |
| 2012 | 43,114 | 43,785 | 41,980 | 42,756 | 39,127 | 41,308 | 42,680 | 38,744 | 40,864 | 42,910 | 46,380 | 48,642 |
| 2013 | 47,696 | 43,616 | 46,638 | 45,121 | 47,350 | 46,351 | 45,448 | 46,454 | 48,531 | 46,860 | 46,327 | 47,402 |
| 2014 | 49,801 | 50,024 | 50,594 | 48,921 | 47,187 | 45,804 | 48,279 | 47,441 | 47,988 | 48,962 | 53,350 | 53,527 |
| 2015 | 52,672 | 54,824 | 51,783 | 50,232 | 48,982 | 48,881 | 50,652 | 48,101 | 49,407 | 49,094 | 51,057 | 56,124 |
| 2016 | 58,573 | 56,407 | 56,766 | 55,531 | 54,235 | 53,845 | 53,820 | 51,969 | 56,878 | 53,091 | 57,082 | 55,663 |
| 2017 | 59,343 | 55,688 | 54,103 | 56,010 | 56,390 | 56,368 | 54,857 | 53,978 | 52,656 | 54,453 | 53,413 | 57,595 |
| 2018 | 59,152 | 60,829 | 59,322 | 54,797 | 56,433 | 56,553 | 52,837 | 54,401 | 55,325 | 56,845 | 56,307 | 61,375 |
| 2019 | 60,170 | 62,403 | 57,216 | 57,393 | 57,821 | 56,017 | 58,818 | 52,190 | 55,327 | 58,467 | 59,224 | 63,164 |
| 2020 | 66,961 | 61,465 | 61,881 | 64,959 | 64,043 | 65,929 | 66,202 | 61,428 | 57,025 | 56,663 | 58,527 | 59,140 |
| 2021 | 65,237 | 56,454 | 58,150 | 62,047 | 62,401 | 57,067 | 58,763 | 59,917 | 58,577 | 58,973 | 59,610 | 57,833 |
| 2022 | 61,766 | 64,219 | 61,716 | 63,306 | 58,451 | 60,126 | 62,116 | 58,768 | 56,308 | 57,177 | 59,809 | 56,206 |
| 2023 | 63,490 | 61,196 | 60,314 | 61,139 | 59,505 | 58,339 | 58,878 | 58,748 | 60,069 | 60,371 | 63,213 | 62,639 |
| 2024 | 62,095 | |||||||||||
| - = No Data Reported; -- = Not Applicable; NA = Not Available; W = Withheld to avoid disclosure of individual company data. |
| Release Date: 3/29/2024 |
| Next Release Date: 4/30/2024 |