|
Download Data (XLS File) |
|
||||||||
|
||||||||
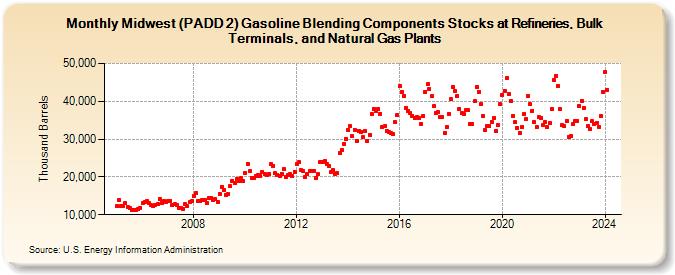
| Midwest (PADD 2) Gasoline Blending Components Stocks at Refineries, Bulk Terminals, and Natural Gas Plants (Thousand Barrels) | ||||||||
| Year | Jan | Feb | Mar | Apr | May | Jun | Jul | Aug | Sep | Oct | Nov | Dec |
|---|---|---|---|---|---|---|---|---|---|---|---|---|
| 2005 | 12,340 | 13,969 | 12,200 | 12,410 | 12,974 | 12,163 | 11,727 | 11,222 | 11,171 | 11,302 | 11,476 | 11,899 |
| 2006 | 13,120 | 13,387 | 13,520 | 13,084 | 12,466 | 12,254 | 12,608 | 12,780 | 14,075 | 13,225 | 13,522 | 13,341 |
| 2007 | 13,681 | 13,685 | 12,503 | 12,713 | 12,572 | 11,839 | 11,807 | 11,643 | 12,712 | 12,205 | 13,251 | 13,607 |
| 2008 | 14,956 | 15,768 | 13,742 | 13,503 | 13,890 | 13,977 | 13,153 | 14,402 | 14,444 | 14,020 | 14,145 | 13,458 |
| 2009 | 15,517 | 17,418 | 16,634 | 15,244 | 15,479 | 17,525 | 19,025 | 18,344 | 19,462 | 19,031 | 19,579 | 18,957 |
| 2010 | 21,087 | 23,495 | 21,461 | 19,771 | 19,731 | 20,214 | 20,479 | 20,355 | 21,342 | 20,883 | 20,507 | 20,652 |
| 2011 | 23,311 | 22,975 | 20,923 | 20,514 | 20,296 | 20,867 | 22,156 | 20,079 | 20,396 | 20,655 | 20,204 | 21,386 |
| 2012 | 23,344 | 23,831 | 21,845 | 21,452 | 20,032 | 20,670 | 21,574 | 21,437 | 21,477 | 19,805 | 20,691 | 23,961 |
| 2013 | 23,844 | 24,131 | 23,374 | 22,844 | 21,298 | 21,810 | 20,866 | 20,903 | 26,325 | 27,103 | 28,738 | 30,136 |
| 2014 | 32,467 | 33,390 | 30,787 | 32,506 | 29,471 | 32,230 | 31,879 | 30,482 | 32,193 | 29,500 | 31,115 | 36,660 |
| 2015 | 37,966 | 37,418 | 37,829 | 36,734 | 33,239 | 33,343 | 32,263 | 31,824 | 31,518 | 31,227 | 34,409 | 36,400 |
| 2016 | 44,089 | 42,467 | 41,400 | 38,341 | 37,440 | 36,810 | 36,194 | 35,555 | 35,833 | 35,649 | 34,040 | 36,235 |
| 2017 | 42,587 | 44,494 | 43,311 | 41,345 | 38,680 | 37,012 | 37,042 | 35,916 | 35,878 | 31,739 | 33,232 | 36,668 |
| 2018 | 40,509 | 43,851 | 42,611 | 41,422 | 38,036 | 36,909 | 36,645 | 37,608 | 37,692 | 33,880 | 33,962 | 40,074 |
| 2019 | 43,804 | 42,552 | 39,209 | 36,003 | 32,279 | 33,542 | 33,380 | 34,636 | 35,606 | 32,130 | 33,771 | 39,180 |
| 2020 | 41,769 | 42,831 | 46,056 | 41,893 | 39,948 | 36,053 | 34,393 | 33,012 | 31,578 | 33,182 | 36,531 | 35,318 |
| 2021 | 41,374 | 39,179 | 37,529 | 34,402 | 33,200 | 35,773 | 35,550 | 33,665 | 34,537 | 33,157 | 34,304 | 37,962 |
| 2022 | 45,733 | 46,664 | 44,130 | 37,973 | 33,605 | 33,486 | 34,907 | 30,674 | 30,945 | 34,084 | 34,695 | 34,897 |
| 2023 | 38,718 | 40,136 | 38,337 | 35,202 | 33,372 | 32,646 | 34,669 | 33,872 | 34,386 | 33,315 | 36,081 | 42,523 |
| 2024 | 47,868 | |||||||||||
| - = No Data Reported; -- = Not Applicable; NA = Not Available; W = Withheld to avoid disclosure of individual company data. |
| Release Date: 3/29/2024 |
| Next Release Date: 4/30/2024 |