|
Download Data (XLS File) |
|
||||||||
|
||||||||
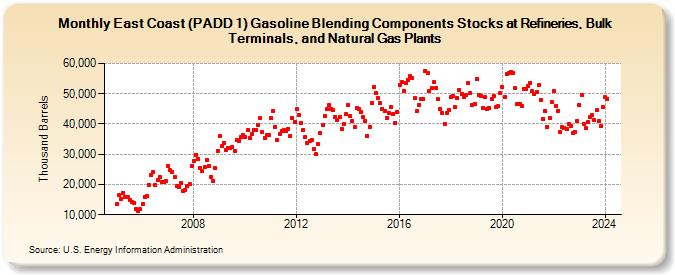
| East Coast (PADD 1) Gasoline Blending Components Stocks at Refineries, Bulk Terminals, and Natural Gas Plants (Thousand Barrels) | ||||||||
| Year | Jan | Feb | Mar | Apr | May | Jun | Jul | Aug | Sep | Oct | Nov | Dec |
|---|---|---|---|---|---|---|---|---|---|---|---|---|
| 2005 | 13,568 | 16,592 | 15,163 | 17,329 | 15,940 | 15,890 | 14,842 | 14,333 | 13,929 | 11,845 | 11,210 | 11,748 |
| 2006 | 13,661 | 15,728 | 16,274 | 19,924 | 23,040 | 24,012 | 19,763 | 21,443 | 22,542 | 20,884 | 20,766 | 21,003 |
| 2007 | 26,084 | 24,735 | 24,250 | 22,468 | 19,541 | 19,258 | 20,359 | 17,741 | 18,279 | 19,335 | 20,049 | 26,150 |
| 2008 | 27,891 | 29,856 | 28,528 | 25,551 | 24,445 | 25,825 | 28,035 | 26,191 | 22,621 | 21,129 | 25,360 | 31,163 |
| 2009 | 35,902 | 32,692 | 33,854 | 31,248 | 32,042 | 32,163 | 32,283 | 31,011 | 34,792 | 34,429 | 35,546 | 36,274 |
| 2010 | 35,826 | 37,951 | 35,329 | 36,677 | 38,009 | 38,141 | 39,735 | 41,813 | 37,399 | 35,375 | 36,336 | 36,425 |
| 2011 | 42,132 | 44,316 | 39,036 | 34,635 | 36,829 | 37,531 | 38,125 | 37,551 | 38,429 | 35,968 | 41,912 | 40,747 |
| 2012 | 44,806 | 43,039 | 40,278 | 37,999 | 35,754 | 33,749 | 34,405 | 34,684 | 31,816 | 29,972 | 33,394 | 36,945 |
| 2013 | 39,609 | 42,636 | 44,787 | 46,141 | 45,048 | 44,506 | 42,412 | 41,238 | 42,279 | 38,473 | 39,839 | 43,153 |
| 2014 | 46,223 | 42,590 | 41,026 | 38,841 | 45,392 | 45,092 | 43,886 | 42,319 | 40,961 | 35,961 | 39,073 | 46,902 |
| 2015 | 52,319 | 50,140 | 48,613 | 46,956 | 45,104 | 44,304 | 42,042 | 43,666 | 45,670 | 43,208 | 40,398 | 43,797 |
| 2016 | 52,989 | 53,780 | 50,929 | 53,640 | 54,679 | 55,744 | 55,064 | 48,455 | 44,133 | 46,259 | 48,380 | 48,262 |
| 2017 | 57,424 | 56,730 | 50,740 | 51,747 | 53,855 | 52,019 | 48,107 | 44,898 | 43,569 | 39,961 | 43,624 | 44,559 |
| 2018 | 48,819 | 49,391 | 45,500 | 48,546 | 51,296 | 49,751 | 48,870 | 49,478 | 53,442 | 50,255 | 46,180 | 46,745 |
| 2019 | 54,898 | 49,553 | 49,099 | 45,329 | 48,920 | 45,043 | 45,299 | 48,239 | 49,411 | 45,591 | 45,941 | 50,212 |
| 2020 | 52,236 | 48,774 | 56,673 | 56,986 | 57,280 | 56,918 | 51,776 | 46,530 | 46,607 | 45,845 | 51,609 | 51,579 |
| 2021 | 52,523 | 53,550 | 50,948 | 49,775 | 50,597 | 52,864 | 48,050 | 41,724 | 44,399 | 38,984 | 41,967 | 47,148 |
| 2022 | 50,797 | 46,107 | 44,318 | 37,440 | 38,892 | 38,732 | 38,281 | 40,047 | 39,460 | 37,009 | 37,293 | 41,096 |
| 2023 | 46,137 | 49,577 | 40,112 | 38,575 | 40,594 | 42,335 | 42,853 | 41,308 | 44,497 | 40,879 | 39,199 | 45,611 |
| 2024 | 48,767 | |||||||||||
| - = No Data Reported; -- = Not Applicable; NA = Not Available; W = Withheld to avoid disclosure of individual company data. |
| Release Date: 3/29/2024 |
| Next Release Date: 4/30/2024 |