|
Download Data (XLS File) |
|
||||||||
|
||||||||
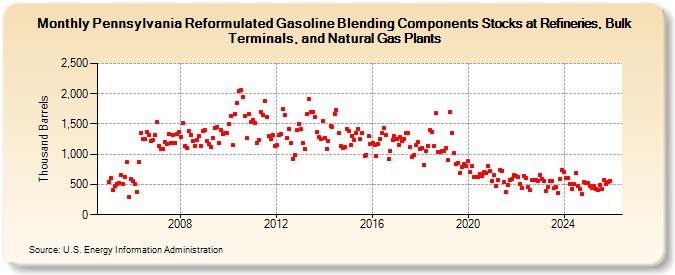
| Pennsylvania Reformulated Gasoline Blending Components Stocks at Refineries, Bulk Terminals, and Natural Gas Plants (Thousand Barrels) | ||||||||
| Year | Jan | Feb | Mar | Apr | May | Jun | Jul | Aug | Sep | Oct | Nov | Dec |
|---|---|---|---|---|---|---|---|---|---|---|---|---|
| 2005 | 535 | 606 | 412 | 482 | 515 | 529 | 657 | 508 | 617 | 867 | 294 | 583 |
| 2006 | 552 | 506 | 383 | 879 | 1,346 | 1,248 | 1,247 | 1,369 | 1,313 | 1,225 | 1,238 | 1,313 |
| 2007 | 1,528 | 1,135 | 1,087 | 1,085 | 1,204 | 1,174 | 1,334 | 1,190 | 1,323 | 1,192 | 1,336 | 1,366 |
| 2008 | 1,291 | 1,523 | 1,138 | 1,097 | 1,385 | 1,314 | 1,219 | 1,143 | 1,243 | 1,299 | 1,138 | 1,391 |
| 2009 | 1,398 | 1,215 | 1,167 | 1,115 | 1,264 | 1,441 | 1,453 | 1,185 | 1,394 | 1,332 | 1,344 | 1,357 |
| 2010 | 1,497 | 1,639 | 1,148 | 1,663 | 1,847 | 2,041 | 2,055 | 1,941 | 1,639 | 1,261 | 1,665 | 1,535 |
| 2011 | 1,562 | 1,508 | 1,179 | 1,241 | 1,703 | 1,655 | 1,879 | 1,616 | 1,293 | 1,250 | 1,323 | 1,135 |
| 2012 | 1,158 | 1,313 | 1,337 | 1,744 | 1,646 | 1,260 | 1,419 | 1,185 | 929 | 988 | 1,399 | 1,501 |
| 2013 | 1,409 | 1,191 | 1,089 | 1,658 | 1,921 | 1,701 | 1,693 | 1,616 | 1,362 | 1,281 | 1,249 | 1,549 |
| 2014 | 1,274 | 1,083 | 1,211 | 1,469 | 1,452 | 1,665 | 1,730 | 1,359 | 1,139 | 1,102 | 1,120 | 1,425 |
| 2015 | 1,386 | 1,146 | 1,304 | 1,243 | 1,345 | 1,423 | 1,253 | 1,347 | 968 | 990 | 1,305 | 1,175 |
| 2016 | 1,190 | 1,147 | 970 | 1,177 | 1,258 | 1,353 | 1,430 | 1,314 | 923 | 1,051 | 1,243 | 1,296 |
| 2017 | 1,246 | 1,160 | 1,284 | 1,220 | 1,252 | 1,348 | 1,344 | 1,112 | 962 | 994 | 1,158 | 1,204 |
| 2018 | 1,086 | 1,100 | 825 | 1,055 | 1,132 | 1,395 | 1,371 | 1,140 | 1,682 | 1,031 | 1,044 | 1,057 |
| 2019 | 1,050 | 1,101 | 901 | 1,698 | 1,358 | 1,013 | 831 | 863 | 692 | 797 | 837 | 805 |
| 2020 | 881 | 703 | 802 | 630 | 618 | 624 | 679 | 648 | 713 | 688 | 809 | 715 |
| 2021 | 557 | 657 | 480 | 581 | 737 | 727 | 536 | 371 | 494 | 578 | 595 | 655 |
| 2022 | 637 | 618 | 504 | 441 | 641 | 608 | 466 | 409 | 569 | 580 | 574 | 559 |
| 2023 | 663 | 592 | 563 | 390 | 462 | 551 | 564 | 442 | 462 | 363 | 594 | 746 |
| 2024 | 706 | |||||||||||
| - = No Data Reported; -- = Not Applicable; NA = Not Available; W = Withheld to avoid disclosure of individual company data. |
| Release Date: 3/29/2024 |
| Next Release Date: 4/30/2024 |