|
Download Data (XLS File) |
|
||||||||
|
||||||||
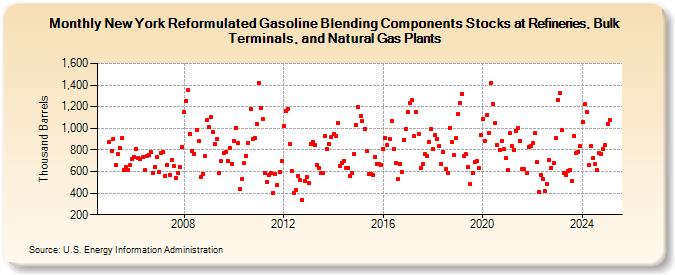
| New York Reformulated Gasoline Blending Components Stocks at Refineries, Bulk Terminals, and Natural Gas Plants (Thousand Barrels) | ||||||||
| Year | Jan | Feb | Mar | Apr | May | Jun | Jul | Aug | Sep | Oct | Nov | Dec |
|---|---|---|---|---|---|---|---|---|---|---|---|---|
| 2005 | 876 | 792 | 905 | 656 | 764 | 822 | 909 | 610 | 638 | 617 | 656 | 713 |
| 2006 | 732 | 811 | 722 | 712 | 730 | 611 | 740 | 755 | 780 | 589 | 645 | 734 |
| 2007 | 592 | 771 | 784 | 560 | 663 | 568 | 709 | 650 | 543 | 588 | 639 | 827 |
| 2008 | 1,147 | 1,257 | 1,351 | 944 | 794 | 763 | 984 | 882 | 548 | 580 | 741 | 1,075 |
| 2009 | 1,015 | 1,102 | 963 | 858 | 901 | 589 | 694 | 771 | 783 | 699 | 818 | 673 |
| 2010 | 885 | 1,006 | 860 | 439 | 529 | 676 | 744 | 865 | 1,177 | 901 | 913 | 1,042 |
| 2011 | 1,422 | 1,190 | 1,083 | 587 | 507 | 572 | 588 | 402 | 579 | 477 | 598 | 700 |
| 2012 | 1,022 | 1,161 | 1,181 | 857 | 604 | 400 | 430 | 556 | 521 | 338 | 516 | 550 |
| 2013 | 498 | 852 | 875 | 845 | 662 | 628 | 582 | 583 | 926 | 810 | 856 | 917 |
| 2014 | 946 | 927 | 1,050 | 651 | 678 | 696 | 635 | 633 | 555 | 586 | 764 | 1,032 |
| 2015 | 1,198 | 1,111 | 1,069 | 994 | 787 | 579 | 578 | 568 | 731 | 674 | 669 | 660 |
| 2016 | 807 | 909 | 847 | 897 | 1,068 | 807 | 680 | 527 | 674 | 599 | 894 | 990 |
| 2017 | 1,155 | 1,232 | 1,260 | 927 | 1,152 | 950 | 632 | 667 | 762 | 748 | 876 | 994 |
| 2018 | 806 | 936 | 900 | 838 | 668 | 780 | 621 | 589 | 1,004 | 869 | 749 | 907 |
| 2019 | 1,131 | 1,237 | 1,317 | 745 | 758 | 638 | 482 | 587 | 687 | 693 | 633 | 942 |
| 2020 | 1,082 | 878 | 1,124 | 959 | 1,421 | 1,226 | 1,046 | 844 | 799 | 878 | 805 | 722 |
| 2021 | 617 | 954 | 840 | 800 | 975 | 1,001 | 887 | 623 | 619 | 584 | 825 | 838 |
| 2022 | 861 | 955 | 684 | 410 | 571 | 528 | 417 | 485 | 703 | 637 | 675 | 914 |
| 2023 | 1,266 | 1,328 | 981 | 584 | 564 | 602 | 617 | 510 | 932 | 768 | 784 | 834 |
| 2024 | 1,058 | |||||||||||
| - = No Data Reported; -- = Not Applicable; NA = Not Available; W = Withheld to avoid disclosure of individual company data. |
| Release Date: 3/29/2024 |
| Next Release Date: 4/30/2024 |