|
Download Data (XLS File) |
|
||||||||
|
||||||||
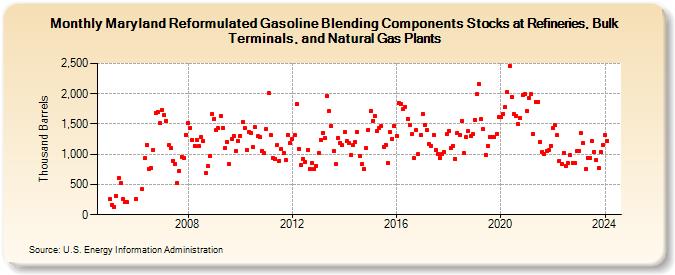
| Maryland Reformulated Gasoline Blending Components Stocks at Refineries, Bulk Terminals, and Natural Gas Plants (Thousand Barrels) | ||||||||
| Year | Jan | Feb | Mar | Apr | May | Jun | Jul | Aug | Sep | Oct | Nov | Dec |
|---|---|---|---|---|---|---|---|---|---|---|---|---|
| 2005 | 252 | 165 | 134 | 312 | 603 | 520 | 252 | 202 | 202 | |||
| 2006 | 254 | 423 | 931 | 1,157 | 761 | 774 | 1,071 | 1,685 | 1,701 | 1,511 | ||
| 2007 | 1,739 | 1,646 | 1,554 | 1,145 | 1,095 | 892 | 835 | 528 | 727 | 961 | 944 | 1,319 |
| 2008 | 1,521 | 1,436 | 1,235 | 1,138 | 1,242 | 1,134 | 1,292 | 1,216 | 684 | 799 | 963 | 1,658 |
| 2009 | 1,590 | 1,397 | 1,427 | 1,640 | 1,438 | 1,096 | 1,207 | 833 | 1,248 | 1,308 | 1,048 | 1,226 |
| 2010 | 1,308 | 1,536 | 1,435 | 1,073 | 1,365 | 1,356 | 1,127 | 1,442 | 1,297 | 1,285 | 1,059 | 1,018 |
| 2011 | 1,419 | 2,006 | 1,321 | 945 | 928 | 1,156 | 895 | 1,085 | 1,028 | 910 | 1,316 | 1,180 |
| 2012 | 1,253 | 1,312 | 1,831 | 1,090 | 822 | 928 | 879 | 1,074 | 757 | 858 | 756 | 813 |
| 2013 | 1,017 | 1,240 | 1,356 | 1,262 | 1,957 | 1,714 | 1,462 | 1,051 | 831 | 1,272 | 1,186 | 1,146 |
| 2014 | 1,365 | 1,211 | 1,191 | 983 | 1,146 | 1,206 | 1,366 | 968 | 838 | 763 | 1,095 | 1,408 |
| 2015 | 1,712 | 1,555 | 1,628 | 1,380 | 1,437 | 1,470 | 1,121 | 1,159 | 861 | 1,363 | 1,259 | 1,464 |
| 2016 | 1,305 | 1,846 | 1,828 | 1,751 | 1,788 | 1,586 | 1,490 | 1,332 | 934 | 1,400 | 997 | 1,321 |
| 2017 | 1,668 | 1,480 | 1,397 | 1,164 | 1,136 | 1,317 | 1,068 | 1,011 | 941 | 1,001 | 1,040 | 1,330 |
| 2018 | 1,388 | 1,102 | 1,137 | 923 | 1,355 | 1,312 | 1,557 | 1,023 | 1,277 | 1,377 | 1,300 | 1,327 |
| 2019 | 1,570 | 1,994 | 2,154 | 1,576 | 1,411 | 993 | 1,142 | 1,292 | 1,281 | 1,290 | 1,334 | 1,612 |
| 2020 | 1,609 | 1,666 | 1,776 | 2,025 | 2,460 | 1,949 | 1,668 | 1,636 | 1,503 | 1,604 | 1,978 | 1,998 |
| 2021 | 1,721 | 1,934 | 1,990 | 1,339 | 1,870 | 1,868 | 1,202 | 1,041 | 1,010 | 1,053 | 1,062 | 1,142 |
| 2022 | 1,429 | 1,477 | 1,313 | 895 | 831 | 1,026 | 808 | 853 | 979 | 860 | 852 | 1,050 |
| 2023 | 1,055 | 1,344 | 1,183 | 749 | 943 | 938 | 1,218 | 1,037 | 902 | 776 | 1,033 | 1,160 |
| 2024 | 1,311 | 1,226 | 1,047 | 1,032 | 967 | 847 | ||||||
| - = No Data Reported; -- = Not Applicable; NA = Not Available; W = Withheld to avoid disclosure of individual company data. |
| Release Date: 8/30/2024 |
| Next Release Date: 9/30/2024 |