|
Download Data (XLS File) |
|
||||||||
|
||||||||
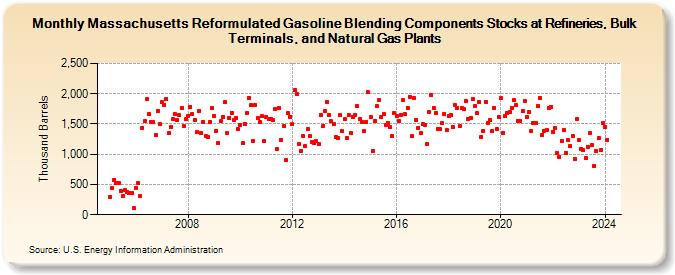
| Massachusetts Reformulated Gasoline Blending Components Stocks at Refineries, Bulk Terminals, and Natural Gas Plants (Thousand Barrels) | ||||||||
| Year | Jan | Feb | Mar | Apr | May | Jun | Jul | Aug | Sep | Oct | Nov | Dec |
|---|---|---|---|---|---|---|---|---|---|---|---|---|
| 2005 | 294 | 440 | 582 | 520 | 520 | 385 | 306 | 408 | 371 | 361 | 354 | 106 |
| 2006 | 448 | 520 | 303 | 1,438 | 1,545 | 1,911 | 1,670 | 1,538 | 1,525 | 1,317 | 1,708 | 1,492 |
| 2007 | 1,861 | 1,821 | 1,909 | 1,345 | 1,447 | 1,583 | 1,659 | 1,572 | 1,643 | 1,766 | 1,468 | 1,582 |
| 2008 | 1,640 | 1,782 | 1,663 | 1,573 | 1,362 | 1,720 | 1,348 | 1,536 | 1,308 | 1,286 | 1,535 | 1,764 |
| 2009 | 1,638 | 1,384 | 1,187 | 1,542 | 1,620 | 1,857 | 1,343 | 1,599 | 1,688 | 1,567 | 1,607 | 1,413 |
| 2010 | 1,483 | 1,178 | 1,507 | 1,678 | 1,936 | 1,816 | 1,221 | 1,816 | 1,597 | 1,527 | 1,631 | 1,213 |
| 2011 | 1,616 | 1,578 | 1,589 | 1,558 | 1,743 | 1,090 | 1,770 | 1,240 | 1,470 | 897 | 1,676 | 1,620 |
| 2012 | 1,501 | 2,057 | 1,996 | 1,177 | 1,059 | 1,300 | 1,132 | 1,415 | 1,304 | 1,207 | 1,189 | 1,212 |
| 2013 | 1,166 | 1,646 | 1,464 | 1,707 | 1,862 | 1,649 | 1,541 | 1,506 | 1,288 | 1,271 | 1,645 | 1,378 |
| 2014 | 1,578 | 1,266 | 1,655 | 1,348 | 1,620 | 1,645 | 1,792 | 1,578 | 1,529 | 1,376 | 1,536 | 2,021 |
| 2015 | 1,612 | 1,059 | 1,541 | 1,792 | 1,889 | 1,620 | 1,662 | 1,479 | 1,518 | 1,445 | 1,294 | 1,675 |
| 2016 | 1,637 | 1,552 | 1,650 | 1,899 | 1,659 | 1,771 | 1,953 | 1,300 | 1,923 | 1,564 | 1,439 | 1,345 |
| 2017 | 1,492 | 1,490 | 1,175 | 1,691 | 1,984 | 1,766 | 1,688 | 1,425 | 1,412 | 1,510 | 1,663 | 1,403 |
| 2018 | 1,630 | 1,656 | 1,451 | 1,807 | 1,772 | 1,470 | 1,765 | 1,753 | 1,878 | 1,588 | 1,599 | 1,914 |
| 2019 | 1,800 | 1,674 | 1,864 | 1,290 | 1,388 | 1,870 | 1,512 | 1,567 | 1,376 | 1,766 | 1,409 | 1,621 |
| 2020 | 1,926 | 1,350 | 1,628 | 1,675 | 1,697 | 1,766 | 1,894 | 1,808 | 1,554 | 1,542 | 1,720 | 1,880 |
| 2021 | 1,615 | 1,697 | 1,384 | 1,509 | 1,515 | 1,805 | 1,935 | 1,326 | 1,385 | 1,400 | 1,762 | 1,781 |
| 2022 | 1,375 | 1,426 | 1,014 | 962 | 1,226 | 1,399 | 1,025 | 1,237 | 1,137 | 1,305 | 926 | 1,583 |
| 2023 | 1,232 | 1,087 | 1,062 | 941 | 1,126 | 1,349 | 1,149 | 806 | 1,057 | 1,268 | 1,072 | 1,523 |
| 2024 | 1,458 | |||||||||||
| - = No Data Reported; -- = Not Applicable; NA = Not Available; W = Withheld to avoid disclosure of individual company data. |
| Release Date: 3/29/2024 |
| Next Release Date: 4/30/2024 |