|
Download Data (XLS File) |
|
||||||||
|
||||||||
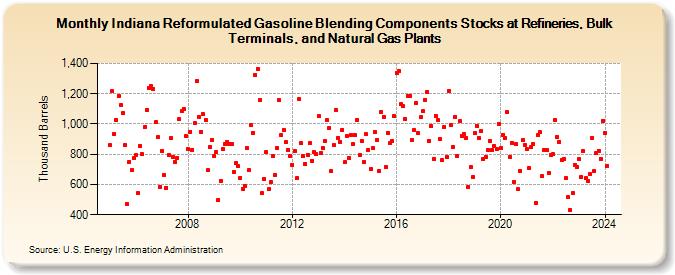
| Indiana Reformulated Gasoline Blending Components Stocks at Refineries, Bulk Terminals, and Natural Gas Plants (Thousand Barrels) | ||||||||
| Year | Jan | Feb | Mar | Apr | May | Jun | Jul | Aug | Sep | Oct | Nov | Dec |
|---|---|---|---|---|---|---|---|---|---|---|---|---|
| 2005 | 858 | 1,216 | 936 | 1,027 | 1,185 | 1,124 | 1,070 | 862 | 468 | 749 | 694 | 775 |
| 2006 | 793 | 543 | 857 | 799 | 980 | 1,094 | 1,237 | 1,248 | 1,233 | 1,010 | 911 | 586 |
| 2007 | 824 | 664 | 579 | 796 | 905 | 782 | 751 | 776 | 1,030 | 1,083 | 1,102 | 919 |
| 2008 | 833 | 950 | 830 | 1,004 | 1,282 | 1,048 | 950 | 1,064 | 1,027 | 693 | 850 | 891 |
| 2009 | 788 | 814 | 500 | 624 | 832 | 870 | 883 | 866 | 870 | 684 | 740 | 720 |
| 2010 | 646 | 572 | 590 | 839 | 694 | 991 | 943 | 1,323 | 1,362 | 1,160 | 541 | 635 |
| 2011 | 816 | 567 | 614 | 787 | 663 | 842 | 1,156 | 925 | 962 | 880 | 829 | 789 |
| 2012 | 729 | 818 | 640 | 1,164 | 871 | 785 | 734 | 798 | 872 | 758 | 814 | 799 |
| 2013 | 1,051 | 811 | 842 | 886 | 1,025 | 975 | 689 | 860 | 1,094 | 909 | 883 | 963 |
| 2014 | 746 | 921 | 774 | 930 | 867 | 924 | 1,028 | 793 | 887 | 748 | 931 | 830 |
| 2015 | 702 | 840 | 946 | 893 | 690 | 1,078 | 1,047 | 715 | 943 | 871 | 890 | 1,053 |
| 2016 | 1,340 | 1,349 | 1,130 | 1,117 | 1,034 | 1,185 | 1,182 | 891 | 957 | 1,136 | 939 | 1,043 |
| 2017 | 1,083 | 1,159 | 1,212 | 890 | 984 | 770 | 1,055 | 1,024 | 898 | 759 | 980 | 780 |
| 2018 | 1,220 | 995 | 850 | 1,047 | 788 | 1,017 | 923 | 933 | 907 | 586 | 716 | 649 |
| 2019 | 938 | 985 | 907 | 952 | 766 | 779 | 830 | 887 | 831 | 855 | 833 | 1,003 |
| 2020 | 842 | 929 | 908 | 1,077 | 784 | 877 | 619 | 866 | 567 | 690 | 895 | 863 |
| 2021 | 832 | 706 | 845 | 869 | 477 | 924 | 944 | 655 | 829 | 826 | 677 | 793 |
| 2022 | 799 | 1,024 | 913 | 882 | 765 | 771 | 640 | 514 | 429 | 542 | 732 | 717 |
| 2023 | 770 | 650 | 821 | 640 | 622 | 666 | 909 | 686 | 810 | 823 | 771 | 1,022 |
| 2024 | 941 | |||||||||||
| - = No Data Reported; -- = Not Applicable; NA = Not Available; W = Withheld to avoid disclosure of individual company data. |
| Release Date: 3/29/2024 |
| Next Release Date: 4/30/2024 |