|
Download Data (XLS File) |
|
||||||||
|
||||||||
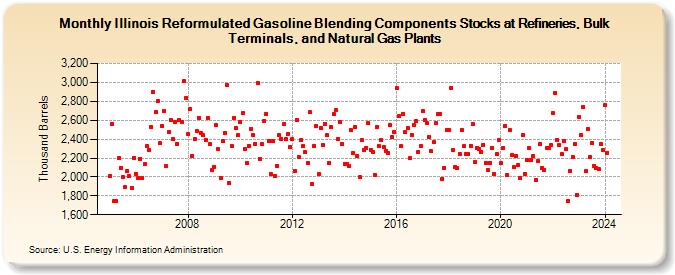
| Illinois Reformulated Gasoline Blending Components Stocks at Refineries, Bulk Terminals, and Natural Gas Plants (Thousand Barrels) | ||||||||
| Year | Jan | Feb | Mar | Apr | May | Jun | Jul | Aug | Sep | Oct | Nov | Dec |
|---|---|---|---|---|---|---|---|---|---|---|---|---|
| 2005 | 2,010 | 2,564 | 1,748 | 1,742 | 2,196 | 2,098 | 2,001 | 1,889 | 2,064 | 2,005 | 1,881 | 2,203 |
| 2006 | 2,034 | 1,992 | 2,193 | 1,986 | 2,133 | 2,323 | 2,289 | 2,532 | 2,901 | 2,685 | 2,804 | 2,354 |
| 2007 | 2,539 | 2,701 | 2,114 | 2,471 | 2,599 | 2,399 | 2,584 | 2,351 | 2,598 | 2,583 | 3,012 | 2,838 |
| 2008 | 2,449 | 2,718 | 2,225 | 2,398 | 2,483 | 2,626 | 2,460 | 2,443 | 2,395 | 2,624 | 2,343 | 2,077 |
| 2009 | 2,110 | 2,546 | 2,292 | 1,985 | 2,377 | 2,461 | 2,969 | 1,938 | 2,332 | 2,627 | 2,520 | 2,441 |
| 2010 | 2,583 | 2,672 | 2,293 | 2,148 | 2,332 | 2,509 | 2,447 | 2,352 | 2,998 | 2,189 | 2,351 | 2,596 |
| 2011 | 2,669 | 2,381 | 2,030 | 2,377 | 2,012 | 2,116 | 2,441 | 2,403 | 2,556 | 2,397 | 2,456 | 2,316 |
| 2012 | 2,398 | 2,063 | 2,605 | 2,212 | 2,392 | 2,329 | 2,259 | 2,152 | 2,684 | 1,930 | 2,330 | 2,539 |
| 2013 | 2,027 | 2,521 | 2,341 | 2,563 | 2,439 | 2,150 | 2,524 | 2,667 | 2,704 | 2,404 | 2,583 | 2,349 |
| 2014 | 2,138 | 2,139 | 2,118 | 2,492 | 2,252 | 2,530 | 2,223 | 1,997 | 2,388 | 2,286 | 2,308 | 2,566 |
| 2015 | 2,288 | 2,266 | 2,023 | 2,529 | 2,324 | 2,392 | 2,316 | 2,275 | 2,250 | 2,545 | 2,420 | 2,478 |
| 2016 | 2,939 | 2,643 | 2,322 | 2,669 | 2,473 | 2,516 | 2,199 | 2,444 | 2,551 | 2,590 | 2,261 | 2,324 |
| 2017 | 2,694 | 2,602 | 2,567 | 2,420 | 2,270 | 2,371 | 2,566 | 2,670 | 2,666 | 1,981 | 2,098 | 2,496 |
| 2018 | 2,500 | 2,945 | 2,280 | 2,102 | 2,089 | 2,247 | 2,500 | 2,322 | 2,243 | 2,242 | 2,329 | 2,565 |
| 2019 | 2,153 | 2,307 | 2,293 | 2,268 | 2,342 | 2,150 | 2,075 | 2,152 | 2,308 | 2,032 | 2,241 | 2,391 |
| 2020 | 2,145 | 2,306 | 2,540 | 2,022 | 2,496 | 2,229 | 2,100 | 2,224 | 2,125 | 1,988 | 2,445 | 2,034 |
| 2021 | 2,174 | 2,308 | 2,180 | 2,222 | 1,966 | 2,173 | 2,343 | 2,098 | 2,077 | 2,306 | 2,301 | 2,334 |
| 2022 | 2,674 | 2,888 | 2,394 | 2,339 | 2,241 | 2,378 | 2,294 | 1,746 | 2,063 | 2,212 | 2,351 | 1,813 |
| 2023 | 2,636 | 2,442 | 2,737 | 2,058 | 2,526 | 2,208 | 2,362 | 2,113 | 2,092 | 2,093 | 2,343 | 2,281 |
| 2024 | 2,758 | 2,258 | 2,602 | 2,354 | 2,278 | 2,160 | ||||||
| - = No Data Reported; -- = Not Applicable; NA = Not Available; W = Withheld to avoid disclosure of individual company data. |
| Release Date: 8/30/2024 |
| Next Release Date: 9/30/2024 |