|
Download Data (XLS File) |
|
||||||||
|
||||||||
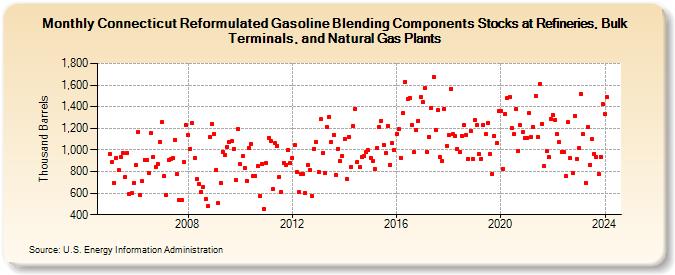
| Connecticut Reformulated Gasoline Blending Components Stocks at Refineries, Bulk Terminals, and Natural Gas Plants (Thousand Barrels) | ||||||||
| Year | Jan | Feb | Mar | Apr | May | Jun | Jul | Aug | Sep | Oct | Nov | Dec |
|---|---|---|---|---|---|---|---|---|---|---|---|---|
| 2005 | 960 | 889 | 696 | 929 | 812 | 933 | 974 | 751 | 972 | 593 | 597 | 697 |
| 2006 | 856 | 1,170 | 580 | 709 | 911 | 907 | 787 | 1,158 | 937 | 843 | 865 | 1,077 |
| 2007 | 1,254 | 756 | 585 | 906 | 914 | 925 | 1,096 | 774 | 534 | 535 | 890 | 1,226 |
| 2008 | 1,142 | 1,012 | 1,246 | 928 | 726 | 687 | 614 | 661 | 542 | 477 | 1,119 | 1,238 |
| 2009 | 1,149 | 816 | 506 | 697 | 985 | 957 | 1,031 | 1,071 | 1,080 | 1,010 | 720 | 1,191 |
| 2010 | 869 | 940 | 836 | 714 | 1,018 | 1,055 | 758 | 759 | 850 | 571 | 874 | 451 |
| 2011 | 877 | 1,111 | 1,087 | 635 | 1,060 | 1,035 | 751 | 609 | 880 | 864 | 999 | 876 |
| 2012 | 927 | 1,043 | 796 | 606 | 778 | 781 | 602 | 859 | 813 | 575 | 1,012 | 1,075 |
| 2013 | 795 | 1,283 | 970 | 784 | 1,213 | 1,305 | 1,073 | 1,141 | 771 | 1,011 | 899 | 948 |
| 2014 | 1,103 | 734 | 1,123 | 842 | 1,221 | 1,382 | 892 | 839 | 937 | 943 | 976 | 996 |
| 2015 | 929 | 899 | 825 | 1,014 | 1,211 | 1,272 | 1,048 | 968 | 1,220 | 864 | 1,061 | 996 |
| 2016 | 1,148 | 1,189 | 928 | 1,338 | 1,631 | 1,468 | 1,481 | 1,232 | 977 | 1,187 | 1,272 | 1,488 |
| 2017 | 1,439 | 1,573 | 982 | 1,123 | 1,392 | 1,673 | 1,185 | 1,368 | 930 | 894 | 1,382 | 1,037 |
| 2018 | 1,140 | 1,564 | 1,143 | 1,127 | 1,012 | 978 | 1,131 | 1,227 | 1,139 | 920 | 1,176 | 919 |
| 2019 | 1,277 | 1,231 | 963 | 919 | 1,235 | 1,144 | 1,247 | 960 | 777 | 1,129 | 1,062 | 1,361 |
| 2020 | 1,360 | 827 | 1,332 | 1,478 | 1,490 | 1,201 | 1,143 | 1,379 | 990 | 1,226 | 1,162 | 1,108 |
| 2021 | 1,112 | 1,339 | 1,121 | 1,214 | 1,501 | 1,121 | 1,611 | 1,242 | 848 | 986 | 930 | 1,286 |
| 2022 | 1,325 | 1,278 | 1,144 | 1,073 | 982 | 982 | 755 | 1,257 | 921 | 784 | 1,317 | 919 |
| 2023 | 1,016 | 1,518 | 1,146 | 698 | 1,212 | 864 | 1,097 | 963 | 931 | 778 | 935 | 1,421 |
| 2024 | 1,332 | |||||||||||
| - = No Data Reported; -- = Not Applicable; NA = Not Available; W = Withheld to avoid disclosure of individual company data. |
| Release Date: 3/29/2024 |
| Next Release Date: 4/30/2024 |