|
Download Data (XLS File) |
|
||||||||
|
||||||||
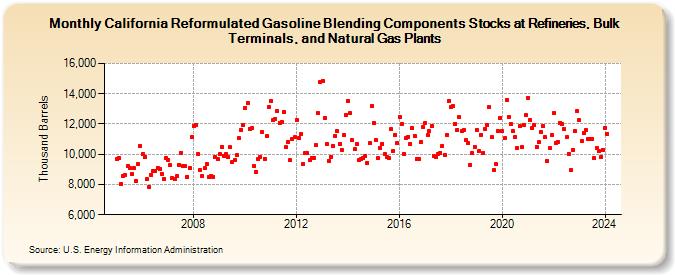
| California Reformulated Gasoline Blending Components Stocks at Refineries, Bulk Terminals, and Natural Gas Plants (Thousand Barrels) | ||||||||
| Year | Jan | Feb | Mar | Apr | May | Jun | Jul | Aug | Sep | Oct | Nov | Dec |
|---|---|---|---|---|---|---|---|---|---|---|---|---|
| 2005 | 9,691 | 9,735 | 8,059 | 8,591 | 8,615 | 9,190 | 9,076 | 8,724 | 9,061 | 8,236 | 9,321 | 10,531 |
| 2006 | 10,000 | 9,843 | 8,332 | 7,856 | 8,649 | 8,889 | 8,911 | 9,112 | 9,044 | 8,719 | 8,385 | 9,722 |
| 2007 | 9,642 | 9,257 | 8,410 | 8,338 | 8,536 | 9,305 | 10,104 | 9,211 | 9,196 | 8,520 | 9,075 | 11,152 |
| 2008 | 11,895 | 11,959 | 10,030 | 8,948 | 8,568 | 9,074 | 9,331 | 8,511 | 8,581 | 8,516 | 9,814 | 9,653 |
| 2009 | 9,998 | 10,506 | 9,913 | 9,999 | 9,788 | 10,459 | 9,495 | 9,611 | 9,940 | 11,047 | 11,602 | 11,931 |
| 2010 | 13,081 | 13,368 | 11,672 | 11,706 | 9,251 | 8,847 | 9,670 | 9,837 | 11,448 | 9,694 | 11,174 | 13,126 |
| 2011 | 13,509 | 12,268 | 12,330 | 12,889 | 12,088 | 12,134 | 12,806 | 10,450 | 10,819 | 9,594 | 11,038 | 11,111 |
| 2012 | 12,255 | 11,074 | 11,313 | 9,357 | 10,079 | 10,072 | 9,589 | 9,767 | 9,781 | 10,613 | 12,721 | 14,802 |
| 2013 | 14,842 | 12,401 | 10,670 | 9,573 | 9,833 | 10,557 | 11,225 | 11,516 | 10,683 | 10,297 | 11,263 | 12,625 |
| 2014 | 13,549 | 12,703 | 10,928 | 10,321 | 10,650 | 9,607 | 9,691 | 9,730 | 9,895 | 9,407 | 10,718 | 13,185 |
| 2015 | 12,072 | 10,942 | 9,724 | 10,406 | 10,694 | 10,005 | 9,815 | 9,722 | 11,644 | 10,199 | 11,284 | 10,720 |
| 2016 | 12,460 | 12,001 | 10,033 | 11,060 | 11,159 | 10,677 | 11,731 | 11,208 | 9,690 | 9,676 | 10,810 | 11,832 |
| 2017 | 12,076 | 11,259 | 11,527 | 11,839 | 9,879 | 9,847 | 10,029 | 10,106 | 10,547 | 9,967 | 11,271 | 13,523 |
| 2018 | 13,110 | 13,183 | 12,019 | 11,617 | 12,438 | 11,518 | 11,619 | 10,938 | 10,732 | 9,290 | 10,064 | 10,492 |
| 2019 | 11,619 | 10,222 | 11,300 | 10,092 | 11,698 | 11,906 | 13,108 | 11,134 | 8,972 | 9,324 | 11,532 | 12,420 |
| 2020 | 11,525 | 11,052 | 13,617 | 12,464 | 11,999 | 11,514 | 11,140 | 10,408 | 11,846 | 10,469 | 11,940 | 12,586 |
| 2021 | 13,747 | 12,262 | 11,764 | 11,926 | 10,482 | 10,805 | 11,488 | 11,851 | 11,130 | 9,543 | 10,411 | 11,281 |
| 2022 | 12,738 | 10,733 | 10,826 | 12,081 | 11,985 | 11,636 | 11,107 | 10,043 | 8,933 | 10,286 | 11,511 | 12,832 |
| 2023 | 12,247 | 10,865 | 11,395 | 11,617 | 10,981 | 10,978 | 11,005 | 9,725 | 10,432 | 10,246 | 9,826 | 10,304 |
| 2024 | 11,758 | 11,338 | ||||||||||
| - = No Data Reported; -- = Not Applicable; NA = Not Available; W = Withheld to avoid disclosure of individual company data. |
| Release Date: 4/30/2024 |
| Next Release Date: 5/31/2024 |