|
Download Data (XLS File) |
|
||||||||
|
||||||||
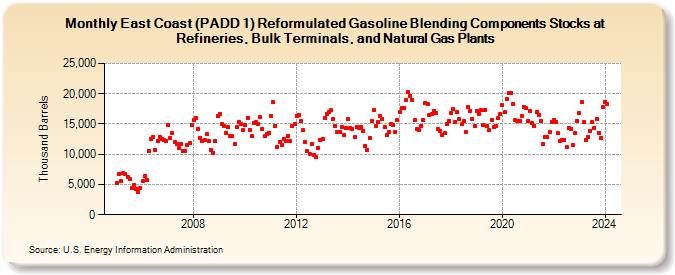
| East Coast (PADD 1) Reformulated Gasoline Blending Components Stocks at Refineries, Bulk Terminals, and Natural Gas Plants (Thousand Barrels) | ||||||||
| Year | Jan | Feb | Mar | Apr | May | Jun | Jul | Aug | Sep | Oct | Nov | Dec |
|---|---|---|---|---|---|---|---|---|---|---|---|---|
| 2005 | 5,221 | 6,768 | 5,548 | 6,902 | 6,685 | 6,185 | 5,835 | 4,393 | 4,973 | 4,221 | 3,736 | 4,420 |
| 2006 | 5,499 | 6,355 | 5,793 | 10,492 | 12,531 | 12,834 | 10,678 | 12,251 | 12,897 | 12,460 | 12,411 | 12,176 |
| 2007 | 14,797 | 12,644 | 13,483 | 11,954 | 11,638 | 11,072 | 11,707 | 10,510 | 10,475 | 11,498 | 11,858 | 14,910 |
| 2008 | 15,615 | 15,969 | 14,189 | 12,721 | 12,217 | 12,325 | 13,308 | 12,212 | 10,712 | 10,209 | 12,158 | 16,375 |
| 2009 | 16,619 | 14,987 | 14,605 | 13,514 | 14,453 | 13,069 | 12,954 | 11,739 | 14,475 | 15,407 | 14,934 | 13,975 |
| 2010 | 14,836 | 16,045 | 14,021 | 12,948 | 15,113 | 15,249 | 15,007 | 16,188 | 14,154 | 13,009 | 13,289 | 13,587 |
| 2011 | 16,345 | 18,562 | 14,652 | 11,224 | 12,027 | 11,604 | 12,501 | 12,247 | 13,007 | 12,127 | 14,624 | 15,019 |
| 2012 | 16,344 | 16,428 | 15,463 | 13,961 | 12,003 | 10,462 | 9,962 | 11,744 | 9,918 | 9,464 | 11,092 | 12,415 |
| 2013 | 12,582 | 15,956 | 16,585 | 16,905 | 17,258 | 15,882 | 14,599 | 13,707 | 13,656 | 14,528 | 13,103 | 14,299 |
| 2014 | 15,870 | 14,359 | 14,200 | 12,859 | 14,551 | 14,380 | 14,465 | 13,918 | 11,429 | 10,678 | 12,656 | 15,462 |
| 2015 | 17,332 | 14,706 | 15,323 | 16,337 | 15,894 | 14,528 | 13,126 | 13,615 | 15,052 | 14,757 | 13,724 | 15,648 |
| 2016 | 16,904 | 17,632 | 17,723 | 18,884 | 20,299 | 19,646 | 19,018 | 15,576 | 14,117 | 14,000 | 14,727 | 15,680 |
| 2017 | 18,520 | 18,302 | 16,451 | 16,677 | 17,132 | 16,791 | 14,160 | 13,864 | 13,132 | 13,468 | 14,968 | 15,535 |
| 2018 | 16,734 | 17,405 | 15,384 | 16,953 | 15,796 | 14,952 | 15,458 | 13,610 | 17,752 | 17,129 | 15,801 | 14,646 |
| 2019 | 17,172 | 16,679 | 17,320 | 14,750 | 17,362 | 14,599 | 13,960 | 15,642 | 14,574 | 14,660 | 15,943 | 16,708 |
| 2020 | 18,161 | 16,937 | 19,053 | 20,093 | 20,182 | 18,289 | 15,584 | 15,537 | 15,523 | 16,324 | 17,821 | 17,601 |
| 2021 | 15,532 | 17,153 | 15,084 | 14,743 | 16,995 | 16,565 | 15,551 | 11,615 | 12,805 | 12,879 | 13,646 | 15,331 |
| 2022 | 15,672 | 15,313 | 13,456 | 12,258 | 12,299 | 12,334 | 11,145 | 14,392 | 14,178 | 11,480 | 13,500 | 15,472 |
| 2023 | 16,786 | 18,610 | 15,315 | 12,344 | 12,919 | 13,866 | 15,316 | 14,387 | 15,783 | 13,570 | 12,688 | 17,737 |
| 2024 | 18,674 | |||||||||||
| - = No Data Reported; -- = Not Applicable; NA = Not Available; W = Withheld to avoid disclosure of individual company data. |
| Release Date: 3/29/2024 |
| Next Release Date: 4/30/2024 |