|
Download Data (XLS File) |
|
||||||||
|
||||||||
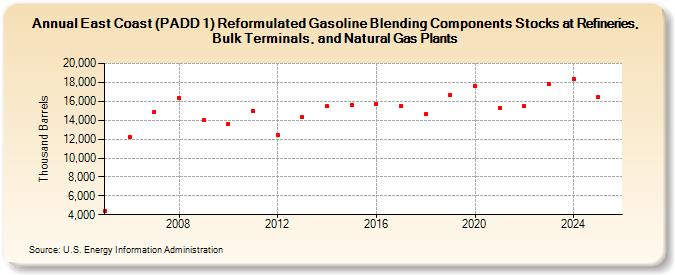
| East Coast (PADD 1) Reformulated Gasoline Blending Components Stocks at Refineries, Bulk Terminals, and Natural Gas Plants (Thousand Barrels) | ||||||||
| Decade | Year-0 | Year-1 | Year-2 | Year-3 | Year-4 | Year-5 | Year-6 | Year-7 | Year-8 | Year-9 |
|---|---|---|---|---|---|---|---|---|---|---|
| 2000's | 4,420 | 12,176 | 14,910 | 16,375 | 13,975 | |||||
| 2010's | 13,587 | 15,019 | 12,415 | 14,299 | 15,462 | 15,648 | 15,680 | 15,535 | 14,646 | 16,708 |
| 2020's | 17,601 | 15,331 | 15,472 | 17,737 |
| - = No Data Reported; -- = Not Applicable; NA = Not Available; W = Withheld to avoid disclosure of individual company data. |
| Release Date: 3/29/2024 |
| Next Release Date: 8/30/2024 |