|
Download Data (XLS File) |
|
||||||||
|
||||||||
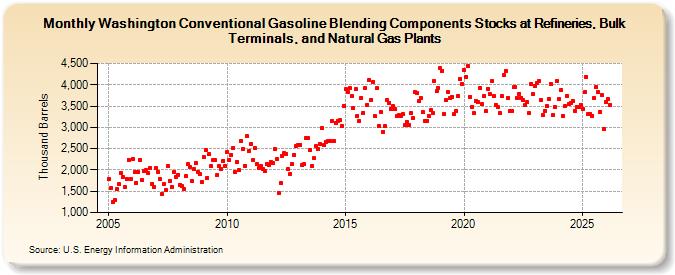
| Washington Conventional Gasoline Blending Components Stocks at Refineries, Bulk Terminals, and Natural Gas Plants (Thousand Barrels) | ||||||||
| Year | Jan | Feb | Mar | Apr | May | Jun | Jul | Aug | Sep | Oct | Nov | Dec |
|---|---|---|---|---|---|---|---|---|---|---|---|---|
| 2005 | 1,788 | 1,568 | 1,253 | 1,290 | 1,547 | 1,662 | 1,939 | 1,843 | 1,599 | 1,787 | 2,245 | 1,783 |
| 2006 | 2,265 | 1,941 | 1,705 | 1,955 | 2,241 | 1,765 | 1,987 | 1,997 | 1,926 | 2,049 | 1,672 | 1,602 |
| 2007 | 2,044 | 1,947 | 1,780 | 1,446 | 1,665 | 1,534 | 2,096 | 1,749 | 1,608 | 1,948 | 1,843 | 1,889 |
| 2008 | 1,657 | 1,613 | 1,563 | 1,851 | 2,134 | 2,077 | 1,740 | 2,011 | 2,163 | 1,953 | 1,903 | 1,720 |
| 2009 | 2,308 | 2,463 | 1,821 | 2,367 | 2,086 | 2,241 | 2,227 | 1,871 | 2,089 | 2,023 | 2,215 | 2,104 |
| 2010 | 2,423 | 2,245 | 2,352 | 2,518 | 1,953 | 2,198 | 1,997 | 2,675 | 2,499 | 2,101 | 2,790 | 2,436 |
| 2011 | 2,610 | 2,238 | 2,506 | 2,131 | 2,047 | 2,082 | 2,023 | 1,967 | 2,149 | 2,121 | 2,194 | 2,167 |
| 2012 | 2,495 | 2,249 | 1,464 | 1,693 | 2,335 | 2,399 | 2,385 | 2,022 | 1,915 | 2,142 | 2,353 | 2,570 |
| 2013 | 2,596 | 2,596 | 2,105 | 2,137 | 2,752 | 2,743 | 2,458 | 2,099 | 2,274 | 2,552 | 2,495 | 2,609 |
| 2014 | 2,975 | 2,576 | 2,666 | 2,673 | 2,686 | 3,159 | 2,678 | 3,101 | 3,161 | 3,166 | 3,041 | 3,503 |
| 2015 | 3,899 | 3,835 | 3,929 | 3,735 | 3,452 | 3,897 | 3,269 | 3,147 | 3,700 | 3,341 | 3,913 | 3,536 |
| 2016 | 4,118 | 3,651 | 4,072 | 3,256 | 3,916 | 3,038 | 3,365 | 2,903 | 3,031 | 3,640 | 3,580 | 3,428 |
| 2017 | 3,496 | 3,443 | 3,262 | 3,284 | 3,277 | 3,307 | 3,050 | 3,128 | 3,059 | 3,329 | 3,211 | 3,828 |
| 2018 | 3,803 | 3,623 | 3,682 | 3,351 | 3,155 | 3,154 | 3,274 | 3,398 | 3,343 | 4,085 | 3,843 | 3,933 |
| 2019 | 4,384 | 4,331 | 3,317 | 3,642 | 3,839 | 3,681 | 3,719 | 3,305 | 3,384 | 3,737 | 4,136 | 4,025 |
| 2020 | 4,347 | 4,185 | 4,442 | 3,724 | 3,474 | 3,326 | 3,622 | 3,591 | 3,917 | 3,543 | 3,738 | 3,384 |
| 2021 | 3,905 | 3,786 | 4,091 | 3,727 | 3,536 | 3,485 | 3,335 | 3,733 | 4,221 | 4,319 | 3,687 | 3,383 |
| 2022 | 3,387 | 3,941 | 3,953 | 3,686 | 3,794 | 3,697 | 3,631 | 3,531 | 3,594 | 3,329 | 4,027 | 3,777 |
| 2023 | 3,970 | 4,050 | 4,088 | 3,639 | 3,280 | 3,429 | 3,549 | 3,695 | 3,998 | 3,291 | 3,489 | 4,080 |
| 2024 | 3,669 | 3,875 | ||||||||||
| - = No Data Reported; -- = Not Applicable; NA = Not Available; W = Withheld to avoid disclosure of individual company data. |
| Release Date: 4/30/2024 |
| Next Release Date: 5/31/2024 |