|
Download Data (XLS File) |
|
||||||||
|
||||||||
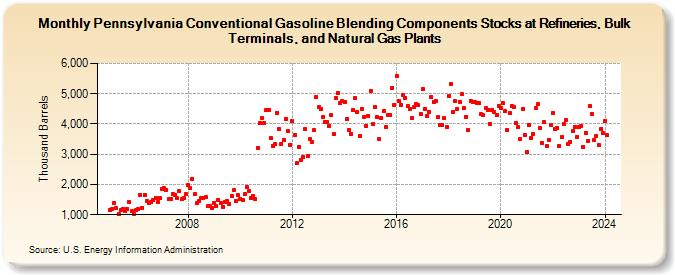
| Pennsylvania Conventional Gasoline Blending Components Stocks at Refineries, Bulk Terminals, and Natural Gas Plants (Thousand Barrels) | ||||||||
| Year | Jan | Feb | Mar | Apr | May | Jun | Jul | Aug | Sep | Oct | Nov | Dec |
|---|---|---|---|---|---|---|---|---|---|---|---|---|
| 2005 | 1,155 | 1,203 | 1,402 | 1,211 | 1,030 | 1,145 | 1,189 | 1,118 | 1,194 | 1,421 | 1,109 | 1,015 |
| 2006 | 1,150 | 1,178 | 1,668 | 1,232 | 1,655 | 1,450 | 1,383 | 1,405 | 1,483 | 1,552 | 1,425 | 1,539 |
| 2007 | 1,861 | 1,868 | 1,824 | 1,509 | 1,504 | 1,688 | 1,663 | 1,542 | 1,773 | 1,511 | 1,542 | 1,679 |
| 2008 | 1,975 | 1,877 | 2,174 | 1,691 | 1,378 | 1,455 | 1,540 | 1,566 | 1,585 | 1,284 | 1,302 | 1,226 |
| 2009 | 1,393 | 1,296 | 1,472 | 1,375 | 1,268 | 1,433 | 1,464 | 1,354 | 1,628 | 1,807 | 1,460 | 1,640 |
| 2010 | 1,529 | 1,501 | 1,669 | 1,915 | 1,769 | 1,568 | 1,629 | 1,514 | 3,222 | 4,040 | 4,210 | 4,048 |
| 2011 | 4,449 | 4,462 | 3,533 | 3,283 | 3,345 | 4,372 | 3,832 | 3,349 | 3,474 | 4,168 | 3,763 | 3,318 |
| 2012 | 4,087 | 3,634 | 2,704 | 3,239 | 2,822 | 2,906 | 3,827 | 2,941 | 3,489 | 3,411 | 3,792 | 4,891 |
| 2013 | 4,546 | 4,484 | 4,235 | 4,060 | 4,076 | 3,931 | 4,281 | 3,674 | 4,862 | 5,029 | 4,681 | 4,748 |
| 2014 | 4,730 | 4,167 | 3,797 | 3,676 | 4,454 | 4,866 | 4,388 | 3,608 | 4,502 | 4,235 | 3,948 | 4,263 |
| 2015 | 5,095 | 4,008 | 4,577 | 4,217 | 3,517 | 4,200 | 4,435 | 3,909 | 4,288 | 4,300 | 5,191 | 4,637 |
| 2016 | 5,579 | 4,754 | 4,635 | 4,964 | 4,872 | 4,593 | 4,507 | 4,199 | 4,547 | 4,663 | 4,611 | 4,316 |
| 2017 | 5,158 | 4,506 | 4,264 | 4,402 | 4,895 | 4,730 | 4,746 | 4,222 | 3,968 | 3,961 | 4,189 | 3,895 |
| 2018 | 4,923 | 5,315 | 4,407 | 4,744 | 4,502 | 4,737 | 4,981 | 4,513 | 4,245 | 3,799 | 4,771 | 4,725 |
| 2019 | 4,712 | 4,708 | 4,680 | 4,315 | 4,283 | 4,516 | 4,447 | 4,000 | 4,458 | 4,399 | 4,285 | 4,602 |
| 2020 | 4,541 | 4,679 | 4,420 | 3,812 | 4,370 | 4,597 | 4,552 | 4,029 | 3,892 | 3,507 | 4,501 | 3,631 |
| 2021 | 3,072 | 3,972 | 3,547 | 3,685 | 4,524 | 4,651 | 3,883 | 3,377 | 4,055 | 3,276 | 3,482 | 3,956 |
| 2022 | 4,363 | 3,825 | 3,869 | 3,275 | 3,568 | 4,002 | 4,127 | 3,347 | 3,403 | 3,784 | 3,914 | 3,570 |
| 2023 | 3,890 | 3,938 | 3,245 | 3,718 | 3,447 | 4,599 | 4,339 | 3,474 | 3,609 | 3,301 | 3,831 | 3,706 |
| 2024 | 4,104 | 3,629 | ||||||||||
| - = No Data Reported; -- = Not Applicable; NA = Not Available; W = Withheld to avoid disclosure of individual company data. |
| Release Date: 4/30/2024 |
| Next Release Date: 5/31/2024 |