|
Download Data (XLS File) |
|
||||||||
|
||||||||
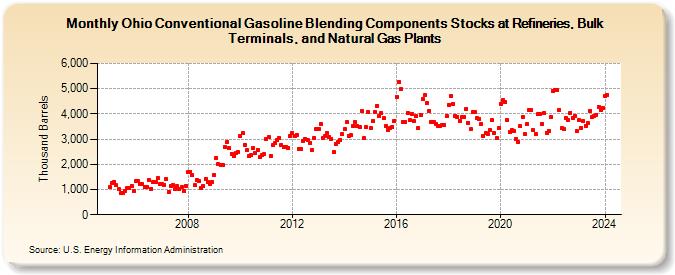
| Ohio Conventional Gasoline Blending Components Stocks at Refineries, Bulk Terminals, and Natural Gas Plants (Thousand Barrels) | ||||||||
| Year | Jan | Feb | Mar | Apr | May | Jun | Jul | Aug | Sep | Oct | Nov | Dec |
|---|---|---|---|---|---|---|---|---|---|---|---|---|
| 2005 | 1,080 | 1,260 | 1,309 | 1,160 | 1,003 | 851 | 857 | 944 | 1,067 | 1,068 | 1,155 | 943 |
| 2006 | 1,329 | 1,333 | 1,232 | 1,214 | 1,087 | 1,116 | 1,393 | 1,028 | 1,317 | 1,288 | 1,452 | 1,226 |
| 2007 | 1,208 | 1,193 | 1,414 | 902 | 1,152 | 1,182 | 1,014 | 1,139 | 1,017 | 1,085 | 956 | 1,154 |
| 2008 | 1,693 | 1,713 | 1,560 | 1,168 | 1,371 | 1,326 | 1,079 | 1,157 | 1,413 | 1,304 | 1,218 | 1,289 |
| 2009 | 1,567 | 2,257 | 2,005 | 1,982 | 1,977 | 2,685 | 2,884 | 2,638 | 2,419 | 2,322 | 2,435 | 2,483 |
| 2010 | 3,128 | 3,235 | 2,777 | 2,550 | 2,316 | 2,353 | 2,662 | 2,432 | 2,584 | 2,284 | 2,371 | 2,400 |
| 2011 | 3,007 | 3,076 | 2,329 | 2,758 | 2,858 | 2,953 | 3,046 | 2,779 | 2,670 | 2,684 | 2,657 | 3,117 |
| 2012 | 3,255 | 3,133 | 3,156 | 2,621 | 2,622 | 2,919 | 3,006 | 2,974 | 2,865 | 2,577 | 3,058 | 3,387 |
| 2013 | 3,407 | 3,600 | 3,042 | 3,104 | 3,223 | 3,079 | 3,014 | 2,479 | 2,822 | 2,879 | 2,968 | 3,199 |
| 2014 | 3,384 | 3,677 | 3,115 | 3,151 | 3,537 | 3,673 | 3,503 | 3,466 | 4,116 | 3,030 | 3,468 | 4,071 |
| 2015 | 3,441 | 3,701 | 4,061 | 4,324 | 3,921 | 4,036 | 3,825 | 3,522 | 3,377 | 3,447 | 3,483 | 3,737 |
| 2016 | 4,680 | 5,272 | 4,987 | 3,678 | 3,684 | 4,040 | 3,738 | 4,011 | 3,707 | 3,906 | 3,440 | 3,948 |
| 2017 | 4,574 | 4,733 | 4,439 | 4,116 | 3,671 | 3,689 | 3,600 | 3,505 | 3,502 | 3,554 | 3,564 | 3,911 |
| 2018 | 4,369 | 4,711 | 4,412 | 3,930 | 3,896 | 3,732 | 3,866 | 3,892 | 4,195 | 3,652 | 3,387 | 4,077 |
| 2019 | 4,062 | 3,854 | 3,808 | 3,597 | 3,129 | 3,235 | 3,200 | 3,354 | 3,752 | 3,227 | 3,034 | 3,426 |
| 2020 | 4,409 | 4,558 | 4,462 | 3,747 | 3,291 | 3,357 | 3,307 | 3,011 | 2,887 | 3,500 | 3,891 | 3,185 |
| 2021 | 3,598 | 4,173 | 4,145 | 3,345 | 3,196 | 3,981 | 4,007 | 3,618 | 4,044 | 3,261 | 3,312 | 3,870 |
| 2022 | 4,923 | 4,960 | 4,940 | 4,170 | 3,429 | 3,400 | 3,838 | 3,766 | 4,055 | 3,837 | 3,924 | 3,317 |
| 2023 | 3,749 | 3,441 | 3,711 | 3,529 | 3,633 | 4,127 | 3,877 | 3,930 | 3,969 | 4,293 | 4,145 | 4,224 |
| 2024 | 4,721 | 4,758 | ||||||||||
| - = No Data Reported; -- = Not Applicable; NA = Not Available; W = Withheld to avoid disclosure of individual company data. |
| Release Date: 4/30/2024 |
| Next Release Date: 5/31/2024 |