|
Download Data (XLS File) |
|
||||||||
|
||||||||
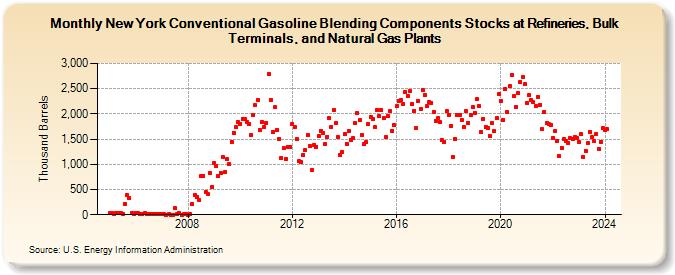
| New York Conventional Gasoline Blending Components Stocks at Refineries, Bulk Terminals, and Natural Gas Plants (Thousand Barrels) | ||||||||
| Year | Jan | Feb | Mar | Apr | May | Jun | Jul | Aug | Sep | Oct | Nov | Dec |
|---|---|---|---|---|---|---|---|---|---|---|---|---|
| 2005 | 25 | 30 | 10 | 25 | 33 | 25 | 20 | 217 | 388 | 333 | 32 | 19 |
| 2006 | 43 | 31 | 15 | 14 | 29 | 15 | 7 | 6 | 6 | 7 | 7 | 5 |
| 2007 | 5 | 6 | 4 | 5 | 4 | 4 | 126 | 5 | 31 | 4 | 6 | 8 |
| 2008 | 4 | 5 | 215 | 389 | 349 | 283 | 759 | 774 | 456 | 408 | 830 | 553 |
| 2009 | 1,021 | 959 | 766 | 832 | 1,143 | 839 | 1,098 | 1,001 | 1,445 | 1,629 | 1,734 | 1,836 |
| 2010 | 1,805 | 1,908 | 1,900 | 1,840 | 1,796 | 1,587 | 1,974 | 2,174 | 2,274 | 1,687 | 1,844 | 1,743 |
| 2011 | 1,815 | 2,795 | 2,271 | 1,644 | 2,127 | 1,675 | 1,508 | 1,130 | 1,328 | 1,111 | 1,351 | 1,349 |
| 2012 | 1,795 | 1,737 | 1,505 | 1,059 | 1,036 | 1,188 | 1,283 | 1,581 | 1,360 | 895 | 1,383 | 1,352 |
| 2013 | 1,556 | 1,664 | 1,627 | 1,407 | 1,551 | 1,911 | 1,742 | 2,078 | 1,814 | 1,546 | 1,179 | 1,246 |
| 2014 | 1,596 | 1,412 | 1,664 | 1,484 | 1,512 | 1,814 | 2,011 | 1,874 | 1,591 | 1,405 | 1,437 | 1,794 |
| 2015 | 1,943 | 1,906 | 1,731 | 2,083 | 1,959 | 2,074 | 1,914 | 1,539 | 1,958 | 2,049 | 1,661 | 1,776 |
| 2016 | 2,149 | 2,260 | 2,275 | 2,199 | 2,433 | 2,352 | 2,451 | 2,195 | 2,064 | 1,716 | 2,256 | 2,103 |
| 2017 | 2,471 | 2,366 | 2,148 | 2,233 | 2,222 | 2,047 | 1,866 | 1,916 | 1,831 | 1,475 | 1,447 | 2,049 |
| 2018 | 1,975 | 1,769 | 1,147 | 1,499 | 1,981 | 1,982 | 1,873 | 1,734 | 2,053 | 1,822 | 1,982 | 2,128 |
| 2019 | 2,022 | 2,293 | 2,152 | 1,644 | 1,906 | 1,742 | 1,714 | 1,564 | 1,811 | 1,657 | 1,914 | 2,389 |
| 2020 | 2,260 | 1,886 | 2,496 | 2,030 | 2,548 | 2,770 | 2,352 | 2,143 | 2,417 | 2,629 | 2,722 | 2,586 |
| 2021 | 2,216 | 2,366 | 2,283 | 2,233 | 2,153 | 2,342 | 2,182 | 1,698 | 2,047 | 1,818 | 1,790 | 1,788 |
| 2022 | 1,529 | 1,662 | 1,468 | 1,159 | 1,330 | 1,501 | 1,456 | 1,426 | 1,518 | 1,500 | 1,544 | 1,522 |
| 2023 | 1,445 | 1,594 | 1,152 | 1,267 | 1,427 | 1,641 | 1,536 | 1,459 | 1,608 | 1,306 | 1,443 | 1,715 |
| 2024 | 1,671 | 1,691 | ||||||||||
| - = No Data Reported; -- = Not Applicable; NA = Not Available; W = Withheld to avoid disclosure of individual company data. |
| Release Date: 4/30/2024 |
| Next Release Date: 5/31/2024 |