|
Download Data (XLS File) |
|
||||||||
|
||||||||
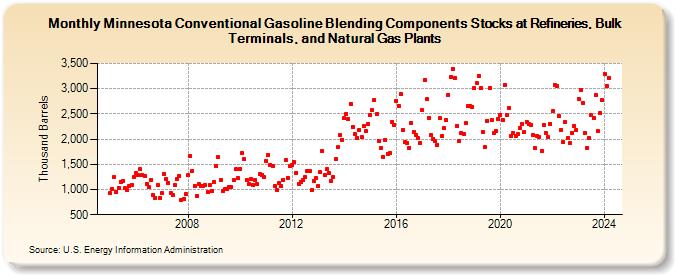
| Minnesota Conventional Gasoline Blending Components Stocks at Refineries, Bulk Terminals, and Natural Gas Plants (Thousand Barrels) | ||||||||
| Year | Jan | Feb | Mar | Apr | May | Jun | Jul | Aug | Sep | Oct | Nov | Dec |
|---|---|---|---|---|---|---|---|---|---|---|---|---|
| 2005 | 926 | 1,015 | 1,250 | 956 | 1,037 | 1,157 | 1,171 | 1,022 | 994 | 1,074 | 1,098 | 1,240 |
| 2006 | 1,325 | 1,280 | 1,404 | 1,280 | 1,267 | 1,114 | 1,043 | 1,198 | 884 | 833 | 1,093 | 838 |
| 2007 | 922 | 1,303 | 1,202 | 1,135 | 924 | 883 | 1,089 | 1,211 | 1,267 | 789 | 819 | 904 |
| 2008 | 1,279 | 1,663 | 1,376 | 1,077 | 868 | 1,101 | 1,063 | 1,070 | 1,089 | 947 | 1,089 | 962 |
| 2009 | 1,158 | 1,473 | 1,636 | 1,184 | 970 | 1,009 | 1,002 | 1,042 | 1,046 | 1,181 | 1,398 | 1,219 |
| 2010 | 1,409 | 1,718 | 1,600 | 1,196 | 1,109 | 1,210 | 1,097 | 1,191 | 1,114 | 1,300 | 1,296 | 1,246 |
| 2011 | 1,568 | 1,690 | 1,489 | 1,474 | 1,079 | 987 | 1,126 | 1,078 | 1,195 | 1,578 | 1,236 | 1,460 |
| 2012 | 1,493 | 1,541 | 1,336 | 1,118 | 1,154 | 1,191 | 1,240 | 1,363 | 1,369 | 988 | 1,175 | 1,223 |
| 2013 | 1,071 | 1,342 | 1,761 | 1,291 | 1,400 | 1,326 | 1,174 | 1,253 | 1,599 | 1,838 | 2,073 | 1,992 |
| 2014 | 2,409 | 2,502 | 2,402 | 2,703 | 2,249 | 2,105 | 2,031 | 2,184 | 2,033 | 2,254 | 2,165 | 2,296 |
| 2015 | 2,483 | 2,572 | 2,775 | 2,498 | 1,968 | 1,826 | 1,652 | 1,990 | 1,710 | 1,716 | 2,345 | 2,288 |
| 2016 | 2,757 | 2,659 | 2,890 | 2,172 | 1,938 | 1,929 | 1,833 | 2,329 | 2,146 | 2,083 | 2,020 | 1,928 |
| 2017 | 2,570 | 3,171 | 2,792 | 2,418 | 2,082 | 2,008 | 1,957 | 1,889 | 2,414 | 2,060 | 2,211 | 2,384 |
| 2018 | 2,883 | 3,235 | 3,398 | 3,219 | 2,266 | 1,972 | 2,116 | 2,107 | 2,318 | 2,648 | 2,658 | 2,634 |
| 2019 | 3,015 | 3,114 | 3,258 | 3,005 | 2,144 | 1,841 | 2,366 | 3,008 | 2,376 | 2,126 | 2,161 | 2,405 |
| 2020 | 2,481 | 2,388 | 3,075 | 2,482 | 2,626 | 2,057 | 2,115 | 2,067 | 2,095 | 2,219 | 2,296 | 2,139 |
| 2021 | 2,346 | 2,307 | 2,287 | 2,086 | 1,815 | 2,066 | 2,042 | 1,767 | 2,284 | 2,123 | 2,036 | 2,307 |
| 2022 | 2,551 | 3,075 | 3,057 | 2,451 | 2,181 | 1,939 | 2,340 | 2,026 | 1,921 | 2,117 | 2,259 | 2,174 |
| 2023 | 2,803 | 2,974 | 2,724 | 2,119 | 1,833 | 2,023 | 2,473 | 2,415 | 2,867 | 2,159 | 2,522 | 2,778 |
| 2024 | 3,293 | 3,048 | ||||||||||
| - = No Data Reported; -- = Not Applicable; NA = Not Available; W = Withheld to avoid disclosure of individual company data. |
| Release Date: 4/30/2024 |
| Next Release Date: 5/31/2024 |