|
Download Data (XLS File) |
|
||||||||
|
||||||||
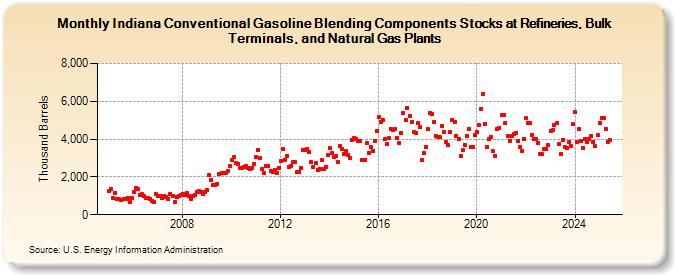
| Indiana Conventional Gasoline Blending Components Stocks at Refineries, Bulk Terminals, and Natural Gas Plants (Thousand Barrels) | ||||||||
| Year | Jan | Feb | Mar | Apr | May | Jun | Jul | Aug | Sep | Oct | Nov | Dec |
|---|---|---|---|---|---|---|---|---|---|---|---|---|
| 2005 | 1,277 | 1,345 | 861 | 1,168 | 853 | 827 | 763 | 840 | 819 | 875 | 671 | 869 |
| 2006 | 1,225 | 1,428 | 1,349 | 1,023 | 1,072 | 974 | 864 | 862 | 828 | 734 | 657 | 1,084 |
| 2007 | 1,000 | 983 | 877 | 989 | 938 | 836 | 1,076 | 998 | 671 | 948 | 989 | 1,023 |
| 2008 | 1,110 | 1,039 | 1,154 | 997 | 817 | 968 | 1,038 | 1,207 | 1,278 | 1,214 | 1,112 | 1,185 |
| 2009 | 1,287 | 2,096 | 1,811 | 1,594 | 1,555 | 1,649 | 2,180 | 2,203 | 2,230 | 2,196 | 2,325 | 2,563 |
| 2010 | 2,874 | 3,036 | 2,729 | 2,705 | 2,452 | 2,478 | 2,538 | 2,551 | 2,458 | 2,440 | 2,494 | 2,696 |
| 2011 | 3,043 | 3,411 | 2,985 | 2,424 | 2,195 | 2,584 | 2,600 | 2,324 | 2,243 | 2,371 | 2,182 | 2,487 |
| 2012 | 2,842 | 3,462 | 2,909 | 3,101 | 2,524 | 2,597 | 2,768 | 2,805 | 2,278 | 2,267 | 2,473 | 3,432 |
| 2013 | 3,427 | 3,478 | 3,293 | 2,764 | 2,516 | 2,718 | 2,375 | 2,440 | 2,880 | 2,413 | 2,506 | 3,134 |
| 2014 | 3,523 | 3,272 | 3,027 | 3,091 | 2,808 | 3,653 | 3,489 | 3,216 | 3,361 | 3,164 | 3,026 | 3,966 |
| 2015 | 4,071 | 3,982 | 3,907 | 3,912 | 2,900 | 2,887 | 3,769 | 3,274 | 3,585 | 3,389 | 3,895 | 4,440 |
| 2016 | 5,177 | 4,917 | 5,031 | 3,981 | 3,752 | 4,043 | 4,534 | 4,497 | 4,543 | 4,084 | 3,817 | 4,341 |
| 2017 | 5,361 | 4,993 | 5,645 | 5,226 | 4,915 | 4,369 | 4,349 | 4,842 | 4,619 | 2,882 | 3,284 | 3,577 |
| 2018 | 4,529 | 5,399 | 5,335 | 4,895 | 4,176 | 4,114 | 4,104 | 4,698 | 4,393 | 3,865 | 3,686 | 4,362 |
| 2019 | 5,001 | 4,887 | 4,181 | 3,996 | 3,123 | 3,408 | 3,700 | 4,156 | 4,540 | 3,596 | 3,592 | 4,193 |
| 2020 | 4,354 | 4,727 | 5,597 | 6,376 | 4,797 | 3,604 | 4,001 | 4,117 | 3,349 | 3,117 | 4,525 | 4,585 |
| 2021 | 5,285 | 5,260 | 4,866 | 4,172 | 3,913 | 4,153 | 4,267 | 4,329 | 3,909 | 3,574 | 3,344 | 4,011 |
| 2022 | 5,096 | 4,847 | 4,876 | 4,232 | 4,005 | 4,008 | 3,769 | 3,225 | 3,203 | 3,452 | 3,461 | 3,663 |
| 2023 | 4,433 | 4,488 | 4,734 | 4,830 | 3,723 | 3,222 | 3,971 | 3,567 | 3,520 | 3,844 | 3,641 | 4,838 |
| 2024 | 5,408 | 3,848 | ||||||||||
| - = No Data Reported; -- = Not Applicable; NA = Not Available; W = Withheld to avoid disclosure of individual company data. |
| Release Date: 4/30/2024 |
| Next Release Date: 5/31/2024 |