|
Download Data (XLS File) |
|
||||||||
|
||||||||
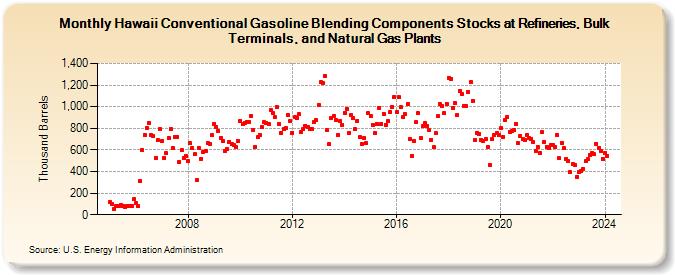
| Hawaii Conventional Gasoline Blending Components Stocks at Refineries, Bulk Terminals, and Natural Gas Plants (Thousand Barrels) | ||||||||
| Year | Jan | Feb | Mar | Apr | May | Jun | Jul | Aug | Sep | Oct | Nov | Dec |
|---|---|---|---|---|---|---|---|---|---|---|---|---|
| 2005 | 117 | 101 | 53 | 77 | 84 | 91 | 81 | 67 | 78 | 80 | 81 | 143 |
| 2006 | 105 | 79 | 310 | 601 | 738 | 804 | 850 | 737 | 726 | 529 | 690 | 796 |
| 2007 | 687 | 529 | 571 | 711 | 793 | 620 | 723 | 723 | 488 | 597 | 526 | 546 |
| 2008 | 494 | 660 | 616 | 559 | 318 | 616 | 519 | 585 | 588 | 663 | 657 | 736 |
| 2009 | 844 | 811 | 776 | 713 | 686 | 588 | 612 | 677 | 652 | 642 | 625 | 683 |
| 2010 | 870 | 836 | 850 | 862 | 856 | 914 | 786 | 629 | 717 | 740 | 814 | 855 |
| 2011 | 853 | 842 | 968 | 940 | 901 | 993 | 839 | 760 | 796 | 800 | 921 | 868 |
| 2012 | 761 | 901 | 896 | 928 | 766 | 789 | 824 | 816 | 794 | 792 | 858 | 873 |
| 2013 | 1,016 | 1,228 | 1,223 | 1,284 | 786 | 653 | 899 | 915 | 875 | 740 | 866 | 834 |
| 2014 | 946 | 981 | 758 | 922 | 891 | 790 | 871 | 715 | 658 | 706 | 661 | 939 |
| 2015 | 910 | 834 | 756 | 837 | 986 | 841 | 935 | 833 | 865 | 953 | 1,000 | 1,090 |
| 2016 | 948 | 1,087 | 996 | 902 | 928 | 1,026 | 698 | 547 | 678 | 858 | 938 | 709 |
| 2017 | 818 | 847 | 820 | 781 | 695 | 624 | 752 | 911 | 1,023 | 1,007 | 938 | 1,028 |
| 2018 | 1,269 | 1,260 | 990 | 1,033 | 925 | 1,146 | 1,119 | 1,010 | 1,005 | 1,136 | 1,224 | 1,057 |
| 2019 | 691 | 759 | 749 | 694 | 684 | 697 | 631 | 461 | 698 | 736 | 755 | 737 |
| 2020 | 800 | 724 | 881 | 900 | 764 | 776 | 787 | 838 | 661 | 727 | 700 | 694 |
| 2021 | 739 | 712 | 705 | 672 | 591 | 631 | 573 | 766 | 677 | 628 | 619 | 644 |
| 2022 | 644 | 626 | 738 | 522 | 667 | 617 | 517 | 499 | 392 | 470 | 458 | 353 |
| 2023 | 399 | 401 | 424 | 496 | 512 | 553 | 573 | 558 | 658 | 620 | 589 | 519 |
| 2024 | 575 | 544 | ||||||||||
| - = No Data Reported; -- = Not Applicable; NA = Not Available; W = Withheld to avoid disclosure of individual company data. |
| Release Date: 4/30/2024 |
| Next Release Date: 5/31/2024 |