|
Download Data (XLS File) |
|
||||||||
|
||||||||
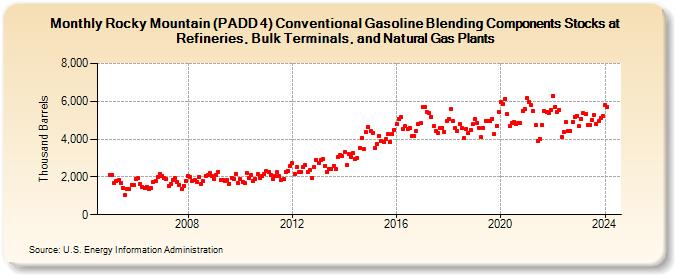
| Rocky Mountain (PADD 4) Conventional Gasoline Blending Components Stocks at Refineries, Bulk Terminals, and Natural Gas Plants (Thousand Barrels) | ||||||||
| Year | Jan | Feb | Mar | Apr | May | Jun | Jul | Aug | Sep | Oct | Nov | Dec |
|---|---|---|---|---|---|---|---|---|---|---|---|---|
| 2005 | 2,114 | 2,110 | 1,684 | 1,794 | 1,810 | 1,694 | 1,417 | 1,053 | 1,349 | 1,359 | 1,593 | 1,580 |
| 2006 | 1,903 | 1,937 | 1,618 | 1,468 | 1,413 | 1,461 | 1,342 | 1,399 | 1,724 | 1,785 | 1,971 | 2,146 |
| 2007 | 2,069 | 1,917 | 1,872 | 1,523 | 1,617 | 1,846 | 1,933 | 1,710 | 1,585 | 1,355 | 1,522 | 1,798 |
| 2008 | 2,070 | 1,985 | 1,802 | 1,813 | 1,745 | 1,998 | 1,647 | 1,773 | 2,041 | 2,080 | 2,200 | 2,058 |
| 2009 | 1,885 | 2,079 | 2,275 | 1,835 | 1,835 | 1,783 | 1,829 | 1,641 | 1,957 | 1,885 | 2,169 | 1,675 |
| 2010 | 1,878 | 1,724 | 1,654 | 2,186 | 1,936 | 2,117 | 1,783 | 1,907 | 2,147 | 1,928 | 2,060 | 2,148 |
| 2011 | 2,325 | 2,239 | 2,101 | 1,913 | 2,065 | 2,242 | 2,033 | 1,818 | 1,877 | 2,271 | 2,317 | 2,588 |
| 2012 | 2,730 | 2,152 | 2,522 | 2,235 | 2,263 | 2,503 | 2,616 | 2,248 | 2,375 | 1,965 | 2,519 | 2,900 |
| 2013 | 2,743 | 2,904 | 2,942 | 2,577 | 2,258 | 2,398 | 2,407 | 2,577 | 2,395 | 3,064 | 3,147 | 3,086 |
| 2014 | 3,312 | 2,618 | 3,204 | 3,079 | 3,256 | 2,973 | 3,025 | 3,504 | 4,054 | 3,461 | 4,358 | 4,622 |
| 2015 | 4,409 | 4,349 | 3,510 | 3,739 | 4,169 | 3,877 | 3,822 | 4,000 | 4,248 | 3,858 | 4,291 | 4,495 |
| 2016 | 4,783 | 5,066 | 5,151 | 4,520 | 4,681 | 4,511 | 4,590 | 4,146 | 4,152 | 4,404 | 4,808 | 4,835 |
| 2017 | 5,699 | 5,710 | 5,450 | 5,389 | 5,156 | 4,689 | 4,403 | 4,343 | 4,605 | 4,608 | 4,385 | 4,983 |
| 2018 | 5,076 | 5,576 | 4,957 | 4,583 | 4,434 | 4,783 | 4,575 | 4,033 | 4,521 | 4,320 | 4,472 | 4,777 |
| 2019 | 5,049 | 4,852 | 4,587 | 4,088 | 4,596 | 4,970 | 4,948 | 4,950 | 5,079 | 4,258 | 4,708 | 5,452 |
| 2020 | 5,973 | 5,862 | 6,138 | 5,316 | 4,679 | 4,876 | 4,907 | 4,774 | 4,848 | 4,828 | 5,503 | 5,587 |
| 2021 | 6,168 | 5,984 | 5,796 | 5,469 | 4,727 | 3,914 | 3,988 | 4,750 | 5,462 | 5,416 | 5,371 | 5,540 |
| 2022 | 6,294 | 5,719 | 5,458 | 5,542 | 4,101 | 4,377 | 4,880 | 4,441 | 4,416 | 4,912 | 5,182 | 5,242 |
| 2023 | 4,677 | 5,084 | 5,360 | 5,324 | 4,750 | 4,748 | 4,997 | 5,276 | 4,779 | 4,937 | 5,123 | 5,226 |
| 2024 | 5,805 | |||||||||||
| - = No Data Reported; -- = Not Applicable; NA = Not Available; W = Withheld to avoid disclosure of individual company data. |
| Release Date: 3/29/2024 |
| Next Release Date: 4/30/2024 |