|
Download Data (XLS File) |
|
||||||||
|
||||||||
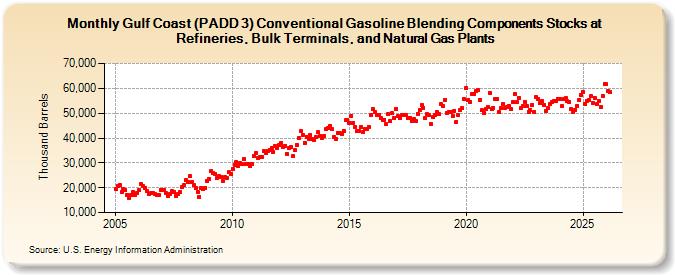
| Gulf Coast (PADD 3) Conventional Gasoline Blending Components Stocks at Refineries, Bulk Terminals, and Natural Gas Plants (Thousand Barrels) | ||||||||
| Year | Jan | Feb | Mar | Apr | May | Jun | Jul | Aug | Sep | Oct | Nov | Dec |
|---|---|---|---|---|---|---|---|---|---|---|---|---|
| 2005 | 19,643 | 20,878 | 21,068 | 18,410 | 19,298 | 18,952 | 17,188 | 16,055 | 17,070 | 18,449 | 17,147 | 17,968 |
| 2006 | 18,973 | 21,315 | 20,556 | 19,829 | 18,479 | 17,345 | 17,695 | 18,020 | 17,461 | 17,032 | 17,204 | 19,131 |
| 2007 | 19,207 | 18,901 | 17,769 | 16,801 | 17,419 | 18,612 | 18,361 | 16,478 | 17,476 | 18,190 | 20,099 | 21,158 |
| 2008 | 22,975 | 22,354 | 24,572 | 22,328 | 20,966 | 20,064 | 18,343 | 16,411 | 20,037 | 19,403 | 20,007 | 22,833 |
| 2009 | 23,650 | 26,737 | 25,908 | 25,639 | 23,917 | 24,738 | 24,481 | 22,771 | 24,228 | 23,872 | 26,213 | 25,488 |
| 2010 | 27,485 | 29,176 | 30,339 | 28,638 | 29,904 | 29,455 | 31,456 | 29,584 | 29,609 | 28,560 | 29,615 | 32,862 |
| 2011 | 34,138 | 32,005 | 32,257 | 32,540 | 34,731 | 33,960 | 34,768 | 35,278 | 36,101 | 34,500 | 36,726 | 35,880 |
| 2012 | 37,042 | 38,019 | 36,463 | 36,980 | 33,658 | 35,870 | 36,303 | 32,834 | 34,987 | 37,218 | 39,970 | 42,739 |
| 2013 | 41,369 | 38,159 | 40,585 | 39,647 | 41,242 | 39,551 | 39,314 | 40,474 | 42,321 | 41,008 | 40,029 | 40,889 |
| 2014 | 43,496 | 44,113 | 45,026 | 43,444 | 40,432 | 39,725 | 42,187 | 41,825 | 41,642 | 42,933 | 47,109 | 47,288 |
| 2015 | 46,208 | 48,873 | 46,208 | 44,393 | 42,715 | 42,911 | 44,413 | 42,507 | 43,674 | 43,634 | 44,546 | 49,171 |
| 2016 | 51,486 | 50,554 | 49,430 | 49,197 | 47,972 | 47,065 | 47,369 | 45,598 | 49,592 | 46,840 | 49,950 | 48,175 |
| 2017 | 51,630 | 48,734 | 48,001 | 49,173 | 49,198 | 49,116 | 47,927 | 47,900 | 46,854 | 47,560 | 46,766 | 49,851 |
| 2018 | 51,249 | 53,237 | 52,146 | 48,097 | 49,600 | 49,185 | 45,606 | 48,278 | 49,405 | 50,307 | 49,596 | 53,623 |
| 2019 | 52,833 | 55,376 | 50,226 | 50,600 | 50,371 | 49,060 | 51,076 | 46,504 | 49,080 | 51,470 | 51,979 | 55,670 |
| 2020 | 59,953 | 55,429 | 54,497 | 57,748 | 57,551 | 58,938 | 59,272 | 55,352 | 51,097 | 50,264 | 51,810 | 52,563 |
| 2021 | 58,286 | 51,713 | 52,127 | 55,674 | 55,727 | 50,445 | 51,882 | 53,844 | 52,221 | 52,663 | 53,061 | 51,533 |
| 2022 | 54,597 | 57,674 | 54,299 | 56,236 | 51,943 | 52,864 | 54,641 | 52,790 | 50,670 | 51,213 | 53,440 | 50,572 |
| 2023 | 56,303 | 55,356 | 53,891 | 54,919 | 53,407 | 51,322 | 52,079 | 53,482 | 54,441 | 54,675 | 56,501 | 55,672 |
| 2024 | 55,653 | 52,410 | ||||||||||
| - = No Data Reported; -- = Not Applicable; NA = Not Available; W = Withheld to avoid disclosure of individual company data. |
| Release Date: 4/30/2024 |
| Next Release Date: 5/31/2024 |