|
Download Data (XLS File) |
|
||||||||
|
||||||||
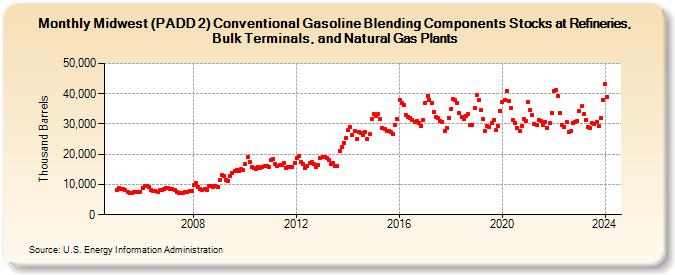
| Midwest (PADD 2) Conventional Gasoline Blending Components Stocks at Refineries, Bulk Terminals, and Natural Gas Plants (Thousand Barrels) | ||||||||
| Year | Jan | Feb | Mar | Apr | May | Jun | Jul | Aug | Sep | Oct | Nov | Dec |
|---|---|---|---|---|---|---|---|---|---|---|---|---|
| 2005 | 8,018 | 8,919 | 8,612 | 8,522 | 8,328 | 7,645 | 7,336 | 7,153 | 7,424 | 7,495 | 7,637 | 7,588 |
| 2006 | 8,903 | 9,475 | 9,468 | 9,171 | 8,111 | 7,714 | 7,796 | 7,582 | 8,307 | 8,284 | 8,338 | 8,725 |
| 2007 | 8,715 | 8,638 | 8,577 | 8,111 | 7,567 | 7,233 | 7,279 | 7,178 | 7,641 | 7,431 | 7,712 | 7,875 |
| 2008 | 9,778 | 10,475 | 9,172 | 8,592 | 8,327 | 8,399 | 8,113 | 9,423 | 9,568 | 9,068 | 9,487 | 9,005 |
| 2009 | 11,321 | 12,965 | 12,643 | 11,618 | 11,011 | 12,888 | 13,708 | 14,445 | 14,911 | 14,455 | 15,138 | 14,658 |
| 2010 | 16,640 | 18,956 | 17,499 | 15,677 | 15,472 | 15,222 | 15,638 | 15,381 | 15,799 | 16,266 | 16,222 | 15,918 |
| 2011 | 18,171 | 18,493 | 16,852 | 16,012 | 16,316 | 16,528 | 17,198 | 15,509 | 15,680 | 15,932 | 15,626 | 16,957 |
| 2012 | 18,673 | 19,477 | 17,419 | 16,636 | 15,525 | 16,116 | 17,178 | 17,281 | 16,669 | 15,800 | 16,298 | 18,900 |
| 2013 | 19,166 | 19,103 | 18,855 | 18,166 | 16,668 | 17,111 | 16,254 | 15,965 | 21,218 | 22,335 | 23,738 | 25,225 |
| 2014 | 27,921 | 28,901 | 26,453 | 27,760 | 24,963 | 27,247 | 27,090 | 26,243 | 27,508 | 25,005 | 26,540 | 31,625 |
| 2015 | 33,321 | 32,543 | 33,164 | 31,713 | 28,604 | 28,297 | 27,742 | 27,678 | 27,216 | 26,556 | 29,513 | 31,548 |
| 2016 | 37,838 | 36,840 | 36,216 | 33,051 | 32,382 | 31,844 | 31,398 | 30,748 | 31,034 | 30,335 | 29,369 | 31,392 |
| 2017 | 37,023 | 39,207 | 38,090 | 36,811 | 34,055 | 32,432 | 32,023 | 30,896 | 30,778 | 27,830 | 28,716 | 32,030 |
| 2018 | 35,099 | 38,330 | 37,841 | 36,892 | 33,588 | 32,317 | 31,763 | 32,683 | 33,159 | 29,516 | 29,695 | 35,385 |
| 2019 | 39,447 | 38,041 | 34,666 | 31,613 | 27,763 | 29,220 | 29,035 | 30,290 | 31,390 | 27,991 | 29,391 | 34,432 |
| 2020 | 37,250 | 38,038 | 40,816 | 37,579 | 35,346 | 31,359 | 30,309 | 28,787 | 27,787 | 29,264 | 31,593 | 31,006 |
| 2021 | 37,178 | 34,753 | 32,961 | 30,064 | 29,648 | 31,390 | 30,866 | 29,554 | 30,754 | 28,831 | 30,238 | 33,727 |
| 2022 | 40,816 | 41,175 | 39,300 | 33,663 | 29,635 | 29,125 | 30,756 | 27,278 | 27,640 | 30,298 | 30,667 | 31,128 |
| 2023 | 34,208 | 35,883 | 33,456 | 31,422 | 29,057 | 28,669 | 30,295 | 30,045 | 30,545 | 29,338 | 31,897 | 37,908 |
| 2024 | 43,073 | |||||||||||
| - = No Data Reported; -- = Not Applicable; NA = Not Available; W = Withheld to avoid disclosure of individual company data. |
| Release Date: 3/29/2024 |
| Next Release Date: 4/30/2024 |