|
Download Data (XLS File) |
|
||||||||
|
||||||||
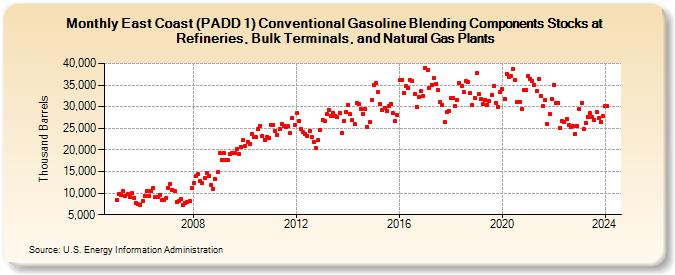
| East Coast (PADD 1) Conventional Gasoline Blending Components Stocks at Refineries, Bulk Terminals, and Natural Gas Plants (Thousand Barrels) | ||||||||
| Year | Jan | Feb | Mar | Apr | May | Jun | Jul | Aug | Sep | Oct | Nov | Dec |
|---|---|---|---|---|---|---|---|---|---|---|---|---|
| 2005 | 8,347 | 9,824 | 9,615 | 10,427 | 9,255 | 9,705 | 9,007 | 9,940 | 8,956 | 7,624 | 7,474 | 7,328 |
| 2006 | 8,162 | 9,373 | 10,481 | 9,432 | 10,509 | 11,178 | 9,085 | 9,192 | 9,645 | 8,424 | 8,355 | 8,827 |
| 2007 | 11,287 | 12,091 | 10,767 | 10,514 | 7,903 | 8,186 | 8,652 | 7,231 | 7,804 | 7,837 | 8,191 | 11,240 |
| 2008 | 12,276 | 13,887 | 14,339 | 12,830 | 12,228 | 13,500 | 14,727 | 13,979 | 11,909 | 10,920 | 13,202 | 14,788 |
| 2009 | 19,283 | 17,705 | 19,249 | 17,734 | 17,589 | 19,094 | 19,329 | 19,272 | 20,317 | 19,022 | 20,612 | 22,299 |
| 2010 | 20,990 | 21,906 | 21,308 | 23,729 | 22,896 | 22,892 | 24,728 | 25,625 | 23,245 | 22,366 | 23,047 | 22,838 |
| 2011 | 25,787 | 25,754 | 24,384 | 23,411 | 24,802 | 25,927 | 25,624 | 25,304 | 25,422 | 23,841 | 27,288 | 25,728 |
| 2012 | 28,462 | 26,611 | 24,815 | 24,038 | 23,751 | 23,287 | 24,443 | 22,940 | 21,898 | 20,508 | 22,302 | 24,530 |
| 2013 | 27,027 | 26,680 | 28,202 | 29,236 | 27,790 | 28,624 | 27,813 | 27,531 | 28,623 | 23,945 | 26,736 | 28,854 |
| 2014 | 30,353 | 28,231 | 26,826 | 25,982 | 30,841 | 30,712 | 29,421 | 28,401 | 29,532 | 25,283 | 26,417 | 31,440 |
| 2015 | 34,987 | 35,434 | 33,290 | 30,619 | 29,210 | 29,776 | 28,916 | 30,051 | 30,618 | 28,451 | 26,674 | 28,149 |
| 2016 | 36,085 | 36,148 | 33,206 | 34,756 | 34,380 | 36,098 | 36,046 | 32,879 | 30,016 | 32,259 | 33,653 | 32,582 |
| 2017 | 38,904 | 38,428 | 34,289 | 35,070 | 36,723 | 35,228 | 33,947 | 31,034 | 30,437 | 26,493 | 28,656 | 29,024 |
| 2018 | 32,085 | 31,986 | 30,116 | 31,593 | 35,500 | 34,799 | 33,412 | 35,868 | 35,690 | 33,126 | 30,379 | 32,099 |
| 2019 | 37,726 | 32,874 | 31,779 | 30,579 | 31,558 | 30,444 | 31,339 | 32,597 | 34,837 | 30,931 | 29,998 | 33,504 |
| 2020 | 34,075 | 31,837 | 37,620 | 36,893 | 37,098 | 38,629 | 36,192 | 30,993 | 31,084 | 29,521 | 33,788 | 33,978 |
| 2021 | 36,991 | 36,397 | 35,864 | 35,032 | 33,602 | 36,299 | 32,499 | 30,109 | 31,594 | 26,105 | 28,321 | 31,817 |
| 2022 | 35,125 | 30,794 | 30,862 | 25,182 | 26,593 | 26,398 | 27,136 | 25,655 | 25,282 | 25,529 | 23,793 | 25,624 |
| 2023 | 29,351 | 30,967 | 24,797 | 26,231 | 27,675 | 28,469 | 27,537 | 26,921 | 28,714 | 27,309 | 26,511 | 27,874 |
| 2024 | 30,093 | 30,106 | ||||||||||
| - = No Data Reported; -- = Not Applicable; NA = Not Available; W = Withheld to avoid disclosure of individual company data. |
| Release Date: 4/30/2024 |
| Next Release Date: 5/31/2024 |