|
Download Data (XLS File) |
|
||||||||
|
||||||||
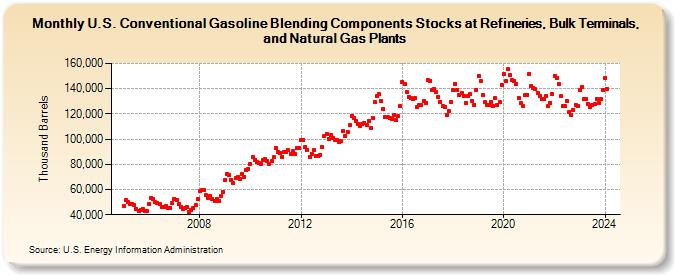
| U.S. Conventional Gasoline Blending Components Stocks at Refineries, Bulk Terminals, and Natural Gas Plants (Thousand Barrels) | ||||||||
| Year | Jan | Feb | Mar | Apr | May | Jun | Jul | Aug | Sep | Oct | Nov | Dec |
|---|---|---|---|---|---|---|---|---|---|---|---|---|
| 2005 | 47,299 | 51,588 | 50,237 | 48,316 | 48,342 | 47,561 | 44,455 | 42,911 | 43,679 | 44,425 | 42,984 | 43,133 |
| 2006 | 48,495 | 53,337 | 52,839 | 49,719 | 48,947 | 48,659 | 45,977 | 46,060 | 46,844 | 45,254 | 45,601 | 49,225 |
| 2007 | 52,770 | 51,872 | 48,135 | 46,051 | 44,751 | 45,097 | 46,259 | 41,959 | 43,373 | 45,397 | 47,385 | 52,343 |
| 2008 | 58,583 | 59,277 | 59,987 | 55,384 | 53,576 | 54,521 | 52,641 | 50,907 | 52,638 | 51,163 | 54,840 | 58,114 |
| 2009 | 67,523 | 71,954 | 71,691 | 67,798 | 65,154 | 69,492 | 69,695 | 68,480 | 72,414 | 70,321 | 75,377 | 76,583 |
| 2010 | 80,323 | 85,825 | 83,614 | 81,895 | 80,852 | 80,418 | 83,638 | 84,256 | 82,420 | 80,286 | 82,314 | 85,439 |
| 2011 | 92,973 | 90,098 | 88,953 | 85,862 | 89,775 | 89,938 | 91,262 | 88,271 | 90,451 | 88,199 | 93,187 | 92,743 |
| 2012 | 99,156 | 99,584 | 94,059 | 91,230 | 85,880 | 88,189 | 91,528 | 86,457 | 86,423 | 87,667 | 94,060 | 102,543 |
| 2013 | 104,224 | 100,139 | 102,872 | 101,165 | 99,157 | 99,522 | 97,711 | 98,152 | 106,107 | 102,314 | 105,688 | 110,800 |
| 2014 | 118,407 | 116,388 | 114,141 | 112,140 | 110,482 | 112,075 | 112,925 | 110,834 | 114,223 | 108,565 | 117,100 | 129,556 |
| 2015 | 134,358 | 135,581 | 130,396 | 123,891 | 117,624 | 117,682 | 116,891 | 115,975 | 118,805 | 115,513 | 118,054 | 125,896 |
| 2016 | 145,679 | 143,491 | 137,580 | 133,748 | 132,336 | 131,464 | 132,548 | 125,193 | 127,336 | 126,768 | 130,419 | 128,887 |
| 2017 | 146,541 | 146,263 | 139,077 | 139,981 | 137,577 | 133,730 | 129,803 | 125,994 | 125,791 | 119,162 | 122,126 | 129,539 |
| 2018 | 138,756 | 143,890 | 139,335 | 134,712 | 136,760 | 134,225 | 128,668 | 134,029 | 135,509 | 130,527 | 127,392 | 139,251 |
| 2019 | 150,286 | 145,996 | 134,913 | 129,435 | 127,439 | 126,755 | 129,656 | 126,321 | 132,567 | 126,735 | 129,300 | 143,294 |
| 2020 | 152,044 | 145,941 | 155,287 | 150,795 | 146,763 | 146,168 | 143,616 | 132,765 | 128,553 | 125,935 | 134,805 | 135,296 |
| 2021 | 152,034 | 142,442 | 140,531 | 139,422 | 136,941 | 134,548 | 131,526 | 131,849 | 134,269 | 126,524 | 128,968 | 135,531 |
| 2022 | 150,204 | 148,763 | 143,411 | 133,926 | 126,015 | 125,921 | 130,383 | 121,621 | 119,004 | 123,432 | 126,801 | 126,305 |
| 2023 | 138,923 | 141,497 | 132,051 | 131,608 | 127,969 | 125,497 | 127,034 | 128,029 | 131,826 | 128,632 | 131,763 | 139,320 |
| 2024 | 148,438 | |||||||||||
| - = No Data Reported; -- = Not Applicable; NA = Not Available; W = Withheld to avoid disclosure of individual company data. |
| Release Date: 3/29/2024 |
| Next Release Date: 4/30/2024 |