|
Download Data (XLS File) |
|
||||||||
|
||||||||
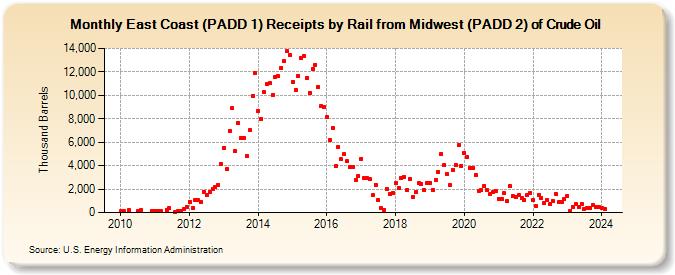
| East Coast (PADD 1) Receipts by Rail from Midwest (PADD 2) of Crude Oil (Thousand Barrels) | ||||||||
| Year | Jan | Feb | Mar | Apr | May | Jun | Jul | Aug | Sep | Oct | Nov | Dec |
|---|---|---|---|---|---|---|---|---|---|---|---|---|
| 2010 | 97 | 97 | 195 | 98 | 196 | 98 | ||||||
| 2011 | 162 | 97 | 97 | 240 | 384 | 32 | 152 | 95 | 270 | 442 | ||
| 2012 | 936 | 410 | 1,049 | 1,059 | 891 | 1,788 | 1,487 | 1,713 | 2,023 | 2,152 | 2,381 | 4,156 |
| 2013 | 5,520 | 3,709 | 6,982 | 8,890 | 5,225 | 7,655 | 6,362 | 6,359 | 4,817 | 7,003 | 9,942 | 11,889 |
| 2014 | 8,660 | 7,977 | 10,255 | 10,992 | 11,006 | 10,062 | 11,568 | 11,624 | 12,355 | 12,885 | 13,754 | 13,433 |
| 2015 | 11,114 | 10,471 | 11,654 | 13,203 | 13,369 | 11,467 | 10,229 | 12,263 | 12,622 | 10,704 | 9,081 | 8,991 |
| 2016 | 8,122 | 6,207 | 7,213 | 3,947 | 5,624 | 4,542 | 4,965 | 4,368 | 3,849 | 3,912 | 2,754 | 3,132 |
| 2017 | 4,610 | 2,939 | 2,962 | 2,838 | 1,477 | 2,387 | 1,056 | 351 | 244 | 2,024 | 1,592 | 1,698 |
| 2018 | 2,484 | 2,115 | 2,951 | 3,063 | 1,903 | 2,871 | 1,334 | 1,712 | 2,508 | 2,451 | 1,938 | 2,554 |
| 2019 | 2,551 | 1,958 | 2,739 | 3,479 | 4,973 | 4,026 | 3,268 | 2,319 | 3,639 | 4,050 | 5,758 | 4,011 |
| 2020 | 5,084 | 4,740 | 3,772 | 3,795 | 3,238 | 1,863 | 1,882 | 2,270 | 1,960 | 1,598 | 1,730 | 1,820 |
| 2021 | 1,198 | 1,166 | 1,627 | 971 | 2,248 | 1,393 | 1,313 | 1,491 | 1,269 | 1,087 | 1,536 | 1,673 |
| 2022 | 1,030 | 575 | 1,498 | 1,242 | 802 | 1,086 | 722 | 994 | 1,613 | 867 | 890 | 1,156 |
| 2023 | 1,396 | 172 | 502 | 707 | 502 | 741 | 344 | 364 | 395 | 619 | 485 | 483 |
| 2024 | 592 | |||||||||||
| - = No Data Reported; -- = Not Applicable; NA = Not Available; W = Withheld to avoid disclosure of individual company data. |
| Release Date: 3/29/2024 |
| Next Release Date: 4/30/2024 |