|
Download Data (XLS File) |
|
||||||||||
|
||||||||||
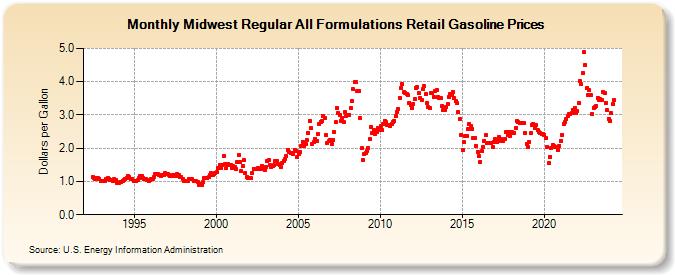
| Midwest Regular All Formulations Retail Gasoline Prices (Dollars per Gallon) | ||||||||||
| Year | Jan | Feb | Mar | Apr | May | Jun | Jul | Aug | Sep | Oct | Nov | Dec |
|---|---|---|---|---|---|---|---|---|---|---|---|---|
| 1992 | NA | 1.135 | 1.102 | 1.083 | 1.098 | 1.090 | 1.079 | 1.028 | ||||
| 1993 | 1.016 | 1.018 | 1.026 | 1.071 | 1.095 | 1.083 | 1.050 | 1.032 | 1.019 | 1.070 | 1.038 | 0.965 |
| 1994 | 0.966 | 0.987 | 0.986 | 1.016 | 1.039 | 1.075 | 1.106 | 1.166 | 1.135 | 1.084 | 1.077 | 1.025 |
| 1995 | 1.025 | 1.024 | 1.035 | 1.097 | 1.161 | 1.167 | 1.109 | 1.081 | 1.076 | 1.043 | 1.024 | 1.049 |
| 1996 | 1.074 | 1.072 | 1.133 | 1.212 | 1.236 | 1.209 | 1.187 | 1.171 | 1.183 | 1.193 | 1.243 | 1.237 |
| 1997 | 1.229 | 1.207 | 1.165 | 1.156 | 1.182 | 1.191 | 1.164 | 1.223 | 1.197 | 1.145 | 1.124 | 1.076 |
| 1998 | 1.024 | 1.013 | 1.006 | 1.023 | 1.067 | 1.068 | 1.065 | 1.020 | 1.004 | 1.011 | 0.971 | 0.903 |
| 1999 | 0.911 | 0.890 | 0.971 | 1.093 | 1.094 | 1.092 | 1.135 | 1.188 | 1.244 | 1.208 | 1.237 | 1.254 |
| 2000 | 1.291 | 1.406 | 1.492 | 1.401 | 1.490 | 1.778 | 1.513 | 1.391 | 1.536 | 1.507 | 1.500 | 1.404 |
| 2001 | 1.454 | 1.437 | 1.374 | 1.579 | 1.789 | 1.589 | 1.309 | 1.473 | 1.634 | 1.254 | 1.131 | 1.089 |
| 2002 | 1.101 | 1.097 | 1.259 | 1.382 | 1.380 | 1.372 | 1.402 | 1.379 | 1.388 | 1.477 | 1.395 | 1.347 |
| 2003 | 1.440 | 1.605 | 1.632 | 1.485 | 1.441 | 1.473 | 1.481 | 1.606 | 1.612 | 1.526 | 1.480 | 1.434 |
| 2004 | 1.560 | 1.618 | 1.680 | 1.755 | 1.956 | 1.872 | 1.852 | 1.845 | 1.838 | 1.950 | 1.908 | 1.748 |
| 2005 | 1.811 | 1.889 | 2.080 | 2.190 | 2.066 | 2.115 | 2.244 | 2.458 | 2.831 | 2.606 | 2.138 | 2.177 |
| 2006 | 2.291 | 2.224 | 2.434 | 2.714 | 2.798 | 2.811 | 2.969 | 2.913 | 2.393 | 2.159 | 2.205 | 2.257 |
| 2007 | 2.125 | 2.256 | 2.489 | 2.773 | 3.223 | 3.062 | 3.001 | 2.827 | 2.918 | 2.785 | 3.073 | 2.957 |
| 2008 | 2.998 | 3.008 | 3.193 | 3.424 | 3.766 | 3.992 | 3.983 | 3.725 | 3.724 | 2.913 | 1.995 | 1.631 |
| 2009 | 1.813 | 1.862 | 1.927 | 1.998 | 2.269 | 2.642 | 2.449 | 2.543 | 2.436 | 2.499 | 2.596 | 2.541 |
| 2010 | 2.667 | 2.561 | 2.727 | 2.823 | 2.776 | 2.688 | 2.699 | 2.679 | 2.719 | 2.785 | 2.828 | 2.960 |
| 2011 | 3.082 | 3.180 | 3.520 | 3.809 | 3.917 | 3.674 | 3.663 | 3.642 | 3.600 | 3.364 | 3.294 | 3.205 |
| 2012 | 3.328 | 3.476 | 3.823 | 3.828 | 3.645 | 3.513 | 3.436 | 3.775 | 3.860 | 3.624 | 3.346 | 3.228 |
| 2013 | 3.203 | 3.648 | 3.657 | 3.541 | 3.733 | 3.748 | 3.535 | 3.523 | 3.500 | 3.271 | 3.145 | 3.151 |
| 2014 | 3.224 | 3.328 | 3.550 | 3.628 | 3.613 | 3.697 | 3.515 | 3.415 | 3.360 | 3.081 | 2.871 | 2.406 |
| 2015 | 1.945 | 2.177 | 2.354 | 2.363 | 2.565 | 2.729 | 2.678 | 2.584 | 2.305 | 2.321 | 2.076 | 1.878 |
| 2016 | 1.756 | 1.599 | 1.910 | 2.027 | 2.219 | 2.384 | 2.148 | 2.142 | 2.153 | 2.146 | 2.032 | 2.185 |
| 2017 | 2.272 | 2.199 | 2.222 | 2.334 | 2.281 | 2.231 | 2.207 | 2.285 | 2.473 | 2.386 | 2.498 | 2.365 |
| 2018 | 2.473 | 2.448 | 2.469 | 2.620 | 2.803 | 2.793 | 2.769 | 2.753 | 2.755 | 2.748 | 2.462 | 2.126 |
| 2019 | 2.035 | 2.186 | 2.442 | 2.704 | 2.740 | 2.617 | 2.682 | 2.542 | 2.486 | 2.466 | 2.423 | 2.419 |
| 2020 | 2.409 | 2.309 | 2.036 | 1.542 | 1.748 | 2.014 | 2.098 | 2.072 | 2.047 | 2.023 | 1.957 | 2.076 |
| 2021 | 2.231 | 2.409 | 2.724 | 2.776 | 2.882 | 2.973 | 3.035 | 3.034 | 3.044 | 3.158 | 3.211 | 3.069 |
| 2022 | 3.112 | 3.357 | 4.024 | 3.915 | 4.260 | 4.879 | 4.496 | 3.809 | 3.590 | 3.744 | 3.587 | 3.014 |
| 2023 | 3.217 | 3.231 | 3.270 | 3.512 | 3.454 | 3.471 | 3.436 | 3.701 | 3.666 | 3.371 | 3.138 | 2.887 |
| 2024 | 2.829 | 3.044 | 3.318 | |||||||||
| - = No Data Reported; -- = Not Applicable; NA = Not Available; W = Withheld to avoid disclosure of individual company data. |
| Release Date: 4/22/2024 |
| Next Release Date: 4/29/2024 |