|
Download Data (XLS File) |
|
||||||||||
|
||||||||||
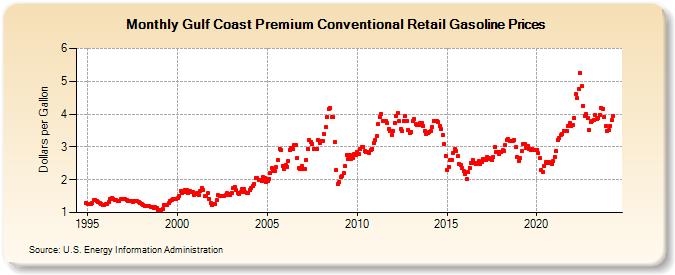
| Gulf Coast Premium Conventional Retail Gasoline Prices (Dollars per Gallon) | ||||||||||
| Year | Jan | Feb | Mar | Apr | May | Jun | Jul | Aug | Sep | Oct | Nov | Dec |
|---|---|---|---|---|---|---|---|---|---|---|---|---|
| 1994 | NA | 1.286 | ||||||||||
| 1995 | 1.270 | 1.263 | 1.257 | 1.297 | 1.372 | 1.385 | 1.351 | 1.311 | 1.289 | 1.262 | 1.238 | 1.244 |
| 1996 | 1.270 | 1.264 | 1.308 | 1.400 | 1.441 | 1.416 | 1.385 | 1.369 | 1.360 | 1.365 | 1.401 | 1.411 |
| 1997 | 1.405 | 1.400 | 1.382 | 1.367 | 1.351 | 1.350 | 1.333 | 1.359 | 1.367 | 1.349 | 1.323 | 1.294 |
| 1998 | 1.263 | 1.226 | 1.196 | 1.200 | 1.194 | 1.185 | 1.183 | 1.157 | 1.139 | 1.159 | 1.133 | 1.086 |
| 1999 | 1.080 | 1.077 | 1.110 | 1.228 | 1.240 | 1.244 | 1.279 | 1.342 | 1.384 | 1.400 | 1.399 | 1.427 |
| 2000 | 1.433 | 1.517 | 1.652 | 1.601 | 1.612 | 1.688 | 1.695 | 1.607 | 1.650 | 1.633 | 1.617 | 1.547 |
| 2001 | 1.567 | 1.586 | 1.535 | 1.659 | 1.761 | 1.690 | 1.490 | 1.491 | 1.584 | 1.428 | 1.290 | 1.226 |
| 2002 | 1.255 | 1.253 | 1.378 | 1.522 | 1.517 | 1.494 | 1.501 | 1.508 | 1.523 | 1.587 | 1.563 | 1.535 |
| 2003 | 1.603 | 1.744 | 1.785 | 1.679 | 1.583 | 1.577 | 1.619 | 1.704 | 1.721 | 1.613 | 1.589 | 1.588 |
| 2004 | 1.691 | 1.742 | 1.806 | 1.875 | 2.045 | 2.045 | 1.992 | 1.980 | 1.958 | 2.078 | 2.067 | 1.944 |
| 2005 | 1.946 | 2.015 | 2.190 | 2.356 | 2.253 | 2.254 | 2.381 | 2.586 | 2.949 | 2.902 | 2.420 | 2.338 |
| 2006 | 2.452 | 2.400 | 2.566 | 2.915 | 2.969 | 2.946 | 3.050 | 3.052 | 2.672 | 2.348 | 2.320 | 2.409 |
| 2007 | 2.323 | 2.335 | 2.614 | 2.936 | 3.209 | 3.164 | 3.085 | 2.930 | 2.933 | 2.940 | 3.202 | 3.129 |
| 2008 | 3.171 | 3.175 | 3.388 | 3.594 | 3.900 | 4.150 | 4.183 | 3.897 | 3.899 | 3.159 | 2.295 | 1.866 |
| 2009 | 1.927 | 2.084 | 2.121 | 2.205 | 2.406 | 2.750 | 2.646 | 2.738 | 2.629 | 2.658 | 2.782 | 2.740 |
| 2010 | 2.853 | 2.790 | 2.930 | 2.996 | 2.993 | 2.860 | 2.836 | 2.849 | 2.822 | 2.908 | 2.948 | 3.104 |
| 2011 | 3.211 | 3.329 | 3.693 | 3.910 | 4.007 | 3.790 | 3.786 | 3.791 | 3.715 | 3.559 | 3.474 | 3.355 |
| 2012 | 3.490 | 3.731 | 3.931 | 4.035 | 3.788 | 3.551 | 3.484 | 3.796 | 3.931 | 3.787 | 3.515 | 3.418 |
| 2013 | 3.463 | 3.775 | 3.842 | 3.686 | 3.662 | 3.677 | 3.716 | 3.723 | 3.651 | 3.473 | 3.395 | 3.436 |
| 2014 | 3.456 | 3.493 | 3.613 | 3.803 | 3.799 | 3.794 | 3.758 | 3.625 | 3.537 | 3.350 | 3.088 | 2.712 |
| 2015 | 2.300 | 2.398 | 2.589 | 2.606 | 2.818 | 2.925 | 2.886 | 2.717 | 2.492 | 2.454 | 2.364 | 2.264 |
| 2016 | 2.170 | 2.036 | 2.235 | 2.359 | 2.516 | 2.607 | 2.515 | 2.469 | 2.496 | 2.559 | 2.475 | 2.552 |
| 2017 | 2.644 | 2.591 | 2.600 | 2.695 | 2.669 | 2.638 | 2.587 | 2.694 | 3.002 | 2.843 | 2.838 | 2.774 |
| 2018 | 2.849 | 2.891 | 2.877 | 3.044 | 3.204 | 3.236 | 3.180 | 3.178 | 3.178 | 3.204 | 2.996 | 2.688 |
| 2019 | 2.571 | 2.650 | 2.867 | 3.086 | 3.099 | 2.966 | 3.033 | 2.938 | 2.914 | 2.930 | 2.899 | 2.892 |
| 2020 | 2.909 | 2.801 | 2.653 | 2.293 | 2.233 | 2.429 | 2.529 | 2.522 | 2.533 | 2.522 | 2.469 | 2.565 |
| 2021 | 2.701 | 2.870 | 3.216 | 3.257 | 3.353 | 3.404 | 3.494 | 3.490 | 3.499 | 3.633 | 3.723 | 3.631 |
| 2022 | 3.655 | 3.876 | 4.601 | 4.477 | 4.770 | 5.263 | 4.840 | 4.256 | 3.945 | 4.005 | 3.866 | 3.512 |
| 2023 | 3.747 | 3.789 | 3.814 | 3.983 | 3.851 | 3.888 | 3.972 | 4.194 | 4.168 | 3.915 | 3.629 | 3.494 |
| 2024 | 3.502 | 3.644 | 3.819 | 3.951 | 3.969 | 3.833 | 3.889 | 3.805 | ||||
| - = No Data Reported; -- = Not Applicable; NA = Not Available; W = Withheld to avoid disclosure of individual company data. |
| Release Date: 9/16/2024 |
| Next Release Date: 9/23/2024 |