|
Download Data (XLS File) |
|
||||||||||
|
||||||||||
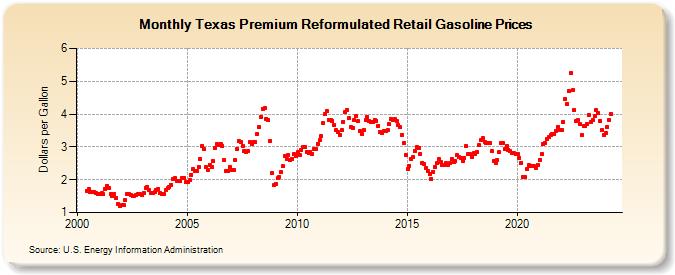
| Texas Premium Reformulated Retail Gasoline Prices (Dollars per Gallon) | ||||||||||
| Year | Jan | Feb | Mar | Apr | May | Jun | Jul | Aug | Sep | Oct | Nov | Dec |
|---|---|---|---|---|---|---|---|---|---|---|---|---|
| 2000 | 1.668 | 1.707 | 1.637 | 1.636 | 1.619 | 1.599 | 1.552 | |||||
| 2001 | 1.567 | 1.586 | 1.551 | 1.720 | 1.821 | 1.753 | 1.569 | 1.499 | 1.559 | 1.447 | 1.268 | 1.188 |
| 2002 | 1.217 | 1.229 | 1.379 | 1.558 | 1.557 | 1.528 | 1.512 | 1.513 | 1.522 | 1.577 | 1.557 | 1.527 |
| 2003 | 1.607 | 1.743 | 1.784 | 1.687 | 1.584 | 1.583 | 1.616 | 1.696 | 1.718 | 1.601 | 1.573 | 1.571 |
| 2004 | 1.678 | 1.746 | 1.789 | 1.854 | 2.022 | 2.044 | 1.974 | 1.959 | 1.952 | 2.062 | 2.053 | 1.925 |
| 2005 | 1.918 | 1.986 | 2.159 | 2.319 | 2.253 | 2.256 | 2.391 | 2.625 | 3.033 | 2.926 | 2.380 | 2.304 |
| 2006 | 2.457 | 2.382 | 2.557 | 2.971 | 3.097 | 3.060 | 3.101 | 3.029 | 2.586 | 2.270 | 2.265 | 2.381 |
| 2007 | 2.302 | 2.308 | 2.593 | 2.942 | 3.176 | 3.135 | 3.038 | 2.876 | 2.845 | 2.868 | 3.140 | 3.088 |
| 2008 | 3.156 | 3.148 | 3.393 | 3.615 | 3.907 | 4.164 | 4.173 | 3.864 | 3.825 | 3.172 | 2.216 | 1.825 |
| 2009 | 1.883 | 2.045 | 2.094 | 2.224 | 2.405 | 2.724 | 2.618 | 2.744 | 2.599 | 2.642 | 2.780 | 2.732 |
| 2010 | 2.833 | 2.757 | 2.903 | 3.002 | 3.005 | 2.858 | 2.828 | 2.840 | 2.795 | 2.923 | 2.945 | 3.097 |
| 2011 | 3.200 | 3.321 | 3.718 | 3.988 | 4.079 | 3.823 | 3.819 | 3.798 | 3.655 | 3.505 | 3.458 | 3.363 |
| 2012 | 3.503 | 3.766 | 4.052 | 4.128 | 3.867 | 3.614 | 3.571 | 3.819 | 3.940 | 3.779 | 3.479 | 3.398 |
| 2013 | 3.517 | 3.818 | 3.914 | 3.788 | 3.752 | 3.762 | 3.824 | 3.797 | 3.646 | 3.468 | 3.420 | 3.483 |
| 2014 | 3.487 | 3.509 | 3.693 | 3.852 | 3.813 | 3.846 | 3.793 | 3.664 | 3.591 | 3.374 | 3.108 | 2.744 |
| 2015 | 2.320 | 2.418 | 2.639 | 2.692 | 2.888 | 2.994 | 2.953 | 2.777 | 2.518 | 2.464 | 2.363 | 2.274 |
| 2016 | 2.186 | 2.019 | 2.237 | 2.381 | 2.498 | 2.617 | 2.541 | 2.442 | 2.445 | 2.507 | 2.451 | 2.498 |
| 2017 | 2.619 | 2.550 | 2.575 | 2.738 | 2.696 | 2.651 | 2.580 | 2.674 | 3.025 | 2.784 | 2.776 | 2.696 |
| 2018 | 2.800 | 2.785 | 2.849 | 3.047 | 3.196 | 3.259 | 3.163 | 3.112 | 3.108 | 3.116 | 2.864 | 2.583 |
| 2019 | 2.513 | 2.606 | 2.838 | 3.107 | 3.124 | 2.945 | 3.023 | 2.913 | 2.871 | 2.822 | 2.803 | 2.787 |
| 2020 | 2.784 | 2.667 | 2.524 | 2.089 | 2.082 | 2.314 | 2.438 | 2.426 | 2.428 | 2.416 | 2.355 | 2.462 |
| 2021 | 2.611 | 2.776 | 3.087 | 3.114 | 3.242 | 3.300 | 3.362 | 3.381 | 3.380 | 3.488 | 3.613 | 3.512 |
| 2022 | 3.527 | 3.769 | 4.469 | 4.318 | 4.700 | 5.238 | 4.728 | 4.121 | 3.785 | 3.814 | 3.686 | 3.365 |
| 2023 | 3.632 | 3.633 | 3.688 | 3.975 | 3.761 | 3.820 | 3.931 | 4.109 | 4.031 | 3.793 | 3.512 | 3.352 |
| 2024 | 3.413 | 3.605 | 3.818 | 4.010 | 3.972 | 3.782 | 3.868 | 3.773 | ||||
| - = No Data Reported; -- = Not Applicable; NA = Not Available; W = Withheld to avoid disclosure of individual company data. |
| Release Date: 9/16/2024 |
| Next Release Date: 9/23/2024 |