|
Download Data (XLS File) |
|
||||||||||
|
||||||||||
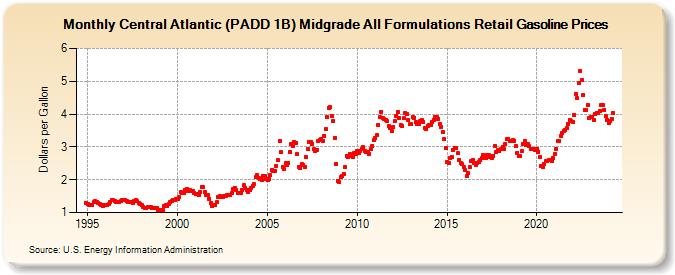
| Central Atlantic (PADD 1B) Midgrade All Formulations Retail Gasoline Prices (Dollars per Gallon) | ||||||||||
| Year | Jan | Feb | Mar | Apr | May | Jun | Jul | Aug | Sep | Oct | Nov | Dec |
|---|---|---|---|---|---|---|---|---|---|---|---|---|
| 1994 | NA | 1.277 | ||||||||||
| 1995 | 1.257 | 1.239 | 1.224 | 1.234 | 1.308 | 1.337 | 1.320 | 1.291 | 1.273 | 1.245 | 1.211 | 1.219 |
| 1996 | 1.233 | 1.228 | 1.247 | 1.325 | 1.387 | 1.372 | 1.344 | 1.320 | 1.309 | 1.314 | 1.349 | 1.382 |
| 1997 | 1.387 | 1.373 | 1.339 | 1.311 | 1.313 | 1.314 | 1.296 | 1.341 | 1.372 | 1.339 | 1.303 | 1.267 |
| 1998 | 1.224 | 1.174 | 1.130 | 1.135 | 1.157 | 1.173 | 1.165 | 1.149 | 1.134 | 1.142 | 1.128 | 1.088 |
| 1999 | 1.075 | 1.054 | 1.071 | 1.185 | 1.217 | 1.214 | 1.249 | 1.317 | 1.364 | 1.392 | 1.390 | 1.414 |
| 2000 | 1.419 | 1.465 | 1.614 | 1.590 | 1.582 | 1.684 | 1.716 | 1.657 | 1.672 | 1.655 | 1.650 | 1.610 |
| 2001 | 1.570 | 1.565 | 1.528 | 1.624 | 1.783 | 1.765 | 1.640 | 1.550 | 1.539 | 1.421 | 1.282 | 1.198 |
| 2002 | 1.219 | 1.218 | 1.308 | 1.476 | 1.492 | 1.478 | 1.483 | 1.509 | 1.516 | 1.534 | 1.546 | 1.543 |
| 2003 | 1.590 | 1.704 | 1.751 | 1.689 | 1.610 | 1.584 | 1.603 | 1.684 | 1.825 | 1.746 | 1.681 | 1.641 |
| 2004 | 1.696 | 1.758 | 1.823 | 1.857 | 2.074 | 2.129 | 2.059 | 2.023 | 1.999 | 2.105 | 2.105 | 2.009 |
| 2005 | 1.979 | 2.021 | 2.130 | 2.294 | 2.265 | 2.274 | 2.423 | 2.602 | 3.182 | 2.830 | 2.389 | 2.329 |
| 2006 | 2.505 | 2.446 | 2.504 | 2.853 | 3.077 | 3.041 | 3.137 | 3.130 | 2.775 | 2.401 | 2.359 | 2.470 |
| 2007 | 2.440 | 2.388 | 2.685 | 2.928 | 3.149 | 3.154 | 3.075 | 2.928 | 2.873 | 2.913 | 3.185 | 3.206 |
| 2008 | 3.237 | 3.192 | 3.338 | 3.544 | 3.896 | 4.184 | 4.204 | 3.956 | 3.782 | 3.274 | 2.485 | 1.972 |
| 2009 | 1.919 | 2.071 | 2.099 | 2.182 | 2.390 | 2.733 | 2.707 | 2.778 | 2.731 | 2.684 | 2.820 | 2.789 |
| 2010 | 2.873 | 2.827 | 2.887 | 2.951 | 2.989 | 2.868 | 2.847 | 2.836 | 2.781 | 2.923 | 3.039 | 3.196 |
| 2011 | 3.273 | 3.349 | 3.669 | 3.900 | 4.077 | 3.886 | 3.839 | 3.825 | 3.774 | 3.629 | 3.572 | 3.473 |
| 2012 | 3.591 | 3.776 | 3.948 | 4.065 | 3.892 | 3.672 | 3.642 | 3.867 | 4.039 | 4.002 | 3.823 | 3.687 |
| 2013 | 3.684 | 3.896 | 3.891 | 3.754 | 3.687 | 3.707 | 3.784 | 3.816 | 3.765 | 3.581 | 3.533 | 3.643 |
| 2014 | 3.671 | 3.663 | 3.751 | 3.822 | 3.901 | 3.897 | 3.858 | 3.697 | 3.607 | 3.449 | 3.232 | 2.967 |
| 2015 | 2.543 | 2.497 | 2.672 | 2.704 | 2.902 | 2.970 | 2.968 | 2.806 | 2.594 | 2.498 | 2.470 | 2.400 |
| 2016 | 2.285 | 2.114 | 2.196 | 2.397 | 2.561 | 2.600 | 2.520 | 2.452 | 2.500 | 2.542 | 2.587 | 2.647 |
| 2017 | 2.759 | 2.698 | 2.675 | 2.750 | 2.743 | 2.701 | 2.661 | 2.730 | 3.034 | 2.858 | 2.913 | 2.866 |
| 2018 | 2.942 | 2.991 | 2.936 | 3.086 | 3.236 | 3.236 | 3.192 | 3.190 | 3.195 | 3.185 | 3.028 | 2.826 |
| 2019 | 2.709 | 2.710 | 2.861 | 3.084 | 3.187 | 3.071 | 3.086 | 3.021 | 2.942 | 2.925 | 2.937 | 2.918 |
| 2020 | 2.951 | 2.854 | 2.693 | 2.426 | 2.383 | 2.487 | 2.569 | 2.571 | 2.596 | 2.594 | 2.582 | 2.658 |
| 2021 | 2.789 | 2.948 | 3.186 | 3.187 | 3.345 | 3.424 | 3.487 | 3.522 | 3.567 | 3.691 | 3.823 | 3.786 |
| 2022 | 3.769 | 3.971 | 4.611 | 4.481 | 4.961 | 5.318 | 5.034 | 4.586 | 4.135 | 4.109 | 4.275 | 3.893 |
| 2023 | 3.907 | 3.904 | 3.833 | 3.997 | 4.028 | 4.032 | 4.090 | 4.290 | 4.266 | 4.128 | 3.944 | 3.832 |
| 2024 | 3.716 | 3.777 | 3.860 | |||||||||
| - = No Data Reported; -- = Not Applicable; NA = Not Available; W = Withheld to avoid disclosure of individual company data. |
| Release Date: 4/22/2024 |
| Next Release Date: 4/29/2024 |