|
Download Data (XLS File) |
|
||||||||
|
||||||||
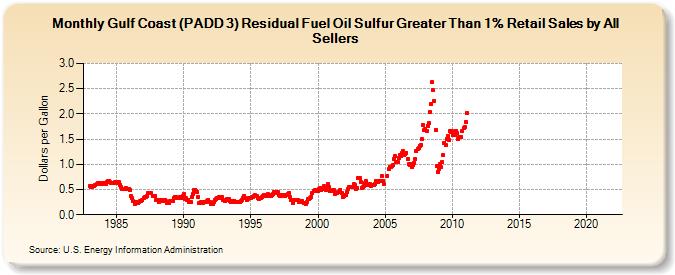
| Gulf Coast (PADD 3) Residual Fuel Oil Sulfur Greater Than 1% Retail Sales by All Sellers (Dollars per Gallon) | ||||||||
| Year | Jan | Feb | Mar | Apr | May | Jun | Jul | Aug | Sep | Oct | Nov | Dec |
|---|---|---|---|---|---|---|---|---|---|---|---|---|
| 1983 | 0.566 | 0.543 | 0.547 | 0.565 | 0.578 | 0.583 | 0.603 | 0.622 | 0.630 | 0.620 | 0.618 | 0.602 |
| 1984 | 0.620 | 0.625 | 0.615 | 0.653 | 0.661 | 0.670 | 0.643 | 0.631 | 0.635 | 0.638 | 0.640 | 0.632 |
| 1985 | 0.644 | 0.654 | 0.641 | 0.596 | 0.550 | 0.503 | 0.514 | 0.519 | 0.538 | 0.510 | 0.504 | 0.514 |
| 1986 | 0.491 | 0.368 | 0.326 | 0.271 | 0.220 | 0.249 | 0.257 | 0.227 | 0.251 | 0.267 | 0.268 | 0.286 |
| 1987 | 0.341 | 0.355 | 0.353 | 0.381 | 0.421 | 0.422 | 0.428 | 0.421 | 0.381 | 0.370 | 0.363 | 0.295 |
| 1988 | 0.283 | 0.284 | 0.251 | 0.270 | 0.287 | 0.290 | 0.263 | 0.299 | 0.270 | 0.225 | 0.239 | 0.240 |
| 1989 | 0.265 | 0.264 | 0.270 | 0.328 | 0.359 | 0.352 | 0.341 | 0.336 | 0.327 | 0.343 | 0.331 | 0.375 |
| 1990 | 0.406 | 0.317 | 0.324 | 0.298 | 0.295 | 0.248 | 0.260 | 0.354 | 0.410 | 0.499 | 0.499 | 0.461 |
| 1991 | 0.449 | 0.350 | 0.241 | 0.250 | 0.235 | 0.233 | 0.260 | 0.248 | 0.245 | 0.276 | 0.298 | 0.260 |
| 1992 | 0.207 | 0.207 | 0.219 | 0.255 | 0.297 | 0.317 | 0.328 | 0.348 | 0.333 | 0.359 | 0.351 | 0.297 |
| 1993 | 0.293 | 0.279 | 0.287 | 0.304 | 0.309 | 0.277 | 0.248 | 0.267 | 0.275 | 0.278 | 0.249 | 0.244 |
| 1994 | 0.245 | 0.260 | 0.249 | 0.269 | 0.291 | 0.324 | 0.373 | 0.337 | 0.282 | 0.310 | 0.334 | 0.336 |
| 1995 | 0.338 | 0.352 | 0.359 | 0.372 | 0.382 | 0.372 | 0.332 | 0.317 | 0.323 | 0.331 | 0.343 | 0.369 |
| 1996 | 0.383 | 0.363 | 0.389 | 0.404 | 0.389 | 0.381 | 0.363 | 0.390 | 0.413 | 0.447 | 0.442 | 0.429 |
| 1997 | 0.446 | 0.395 | 0.364 | 0.369 | 0.385 | 0.383 | 0.371 | 0.389 | 0.391 | 0.409 | 0.430 | 0.358 |
| 1998 | 0.299 | 0.296 | 0.237 | 0.297 | 0.286 | 0.284 | 0.297 | 0.262 | 0.251 | 0.270 | 0.268 | 0.227 |
| 1999 | 0.233 | 0.216 | 0.254 | 0.308 | 0.317 | 0.324 | 0.359 | 0.423 | 0.476 | 0.481 | 0.473 | 0.482 |
| 2000 | 0.470 | 0.506 | 0.532 | 0.482 | 0.516 | 0.560 | 0.520 | 0.490 | 0.556 | 0.608 | 0.545 | 0.477 |
| 2001 | 0.464 | 0.498 | 0.488 | 0.415 | 0.440 | 0.434 | 0.444 | 0.444 | 0.496 | 0.422 | 0.356 | 0.362 |
| 2002 | 0.382 | 0.383 | 0.446 | 0.512 | 0.540 | 0.542 | 0.546 | 0.559 | 0.600 | 0.593 | 0.505 | 0.536 |
| 2003 | 0.720 | 0.725 | 0.655 | 0.537 | 0.544 | 0.566 | 0.637 | 0.662 | 0.590 | 0.616 | 0.609 | 0.576 |
| 2004 | 0.594 | 0.585 | 0.593 | 0.610 | 0.676 | 0.667 | 0.640 | 0.662 | 0.668 | 0.769 | 0.663 | 0.601 |
| 2005 | NA | NA | 0.774 | 0.898 | 0.943 | 0.950 | 0.960 | 0.987 | 1.108 | 1.161 | 1.053 | 1.047 |
| 2006 | 1.124 | 1.178 | 1.164 | 1.220 | 1.257 | 1.186 | 1.196 | 1.231 | 1.106 | 0.999 | 0.986 | 0.999 |
| 2007 | 0.941 | 0.989 | 1.026 | 1.105 | 1.255 | 1.305 | 1.332 | 1.369 | 1.386 | 1.496 | 1.784 | 1.684 |
| 2008 | 1.700 | 1.670 | 1.760 | 1.812 | 2.032 | 2.199 | 2.629 | 2.466 | 2.258 | 1.677 | 0.965 | 0.850 |
| 2009 | 0.911 | 1.014 | 0.938 | 1.041 | 1.184 | 1.429 | 1.384 | 1.504 | 1.552 | 1.490 | 1.651 | 1.635 |
| 2010 | 1.653 | 1.581 | 1.588 | 1.663 | 1.616 | 1.494 | 1.534 | 1.534 | 1.539 | 1.659 | 1.717 | 1.748 |
| 2011 | 1.842 | 2.015 | - | - | - | - | - | - | - | - | - | - |
| 2012 | - | - | - | - | - | - | - | - | - | - | - | - |
| 2013 | - | - | - | - | - | - | - | - | - | - | - | - |
| 2014 | - | - | - | - | - | - | - | - | - | - | - | - |
| 2015 | - | - | - | - | - | - | - | - | - | - | - | - |
| 2016 | - | - | - | - | - | - | - | - | - | - | - | - |
| 2017 | - | - | - | - | - | - | - | - | - | - | - | - |
| 2018 | - | - | - | - | - | - | - | - | - | - | - | - |
| 2019 | - | - | - | - | - | - | - | - | - | - | - | - |
| 2020 | - | - | - | - | - | - | - | - | - | - | - | - |
| 2021 | - | - | - | - | - | - | - | - | - | - | - | - |
| 2022 | - | - | - | |||||||||
| - = No Data Reported; -- = Not Applicable; NA = Not Available; W = Withheld to avoid disclosure of individual company data. |
| Release Date: 6/1/2022 |
| Next Release Date: TBD |