|
Download Data (XLS File) |
|
||||||||
|
||||||||
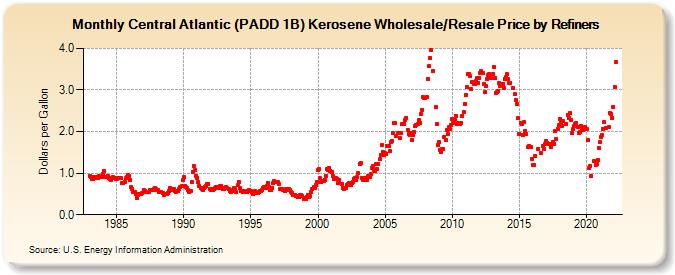
| Central Atlantic (PADD 1B) Kerosene Wholesale/Resale Price by Refiners (Dollars per Gallon) | ||||||||
| Year | Jan | Feb | Mar | Apr | May | Jun | Jul | Aug | Sep | Oct | Nov | Dec |
|---|---|---|---|---|---|---|---|---|---|---|---|---|
| 1983 | 0.940 | 0.916 | 0.858 | 0.858 | 0.914 | 0.888 | 0.903 | 0.888 | 0.923 | 0.904 | 0.902 | 0.897 |
| 1984 | 0.990 | 1.045 | 0.912 | 0.918 | 0.923 | 0.884 | 0.866 | 0.846 | 0.883 | 0.897 | 0.877 | 0.859 |
| 1985 | 0.856 | 0.873 | 0.871 | 0.876 | 0.875 | 0.774 | 0.759 | 0.789 | 0.874 | 0.908 | 0.947 | 0.933 |
| 1986 | 0.827 | 0.664 | 0.629 | 0.538 | 0.542 | 0.487 | 0.410 | 0.479 | 0.502 | 0.490 | 0.502 | 0.524 |
| 1987 | 0.591 | 0.564 | 0.541 | 0.539 | 0.556 | 0.554 | 0.593 | 0.597 | 0.591 | 0.620 | 0.638 | 0.612 |
| 1988 | 0.603 | 0.584 | 0.551 | 0.556 | 0.550 | 0.513 | 0.481 | 0.496 | 0.492 | 0.489 | 0.520 | 0.576 |
| 1989 | 0.644 | 0.603 | 0.610 | 0.614 | 0.568 | 0.545 | 0.563 | 0.572 | 0.618 | 0.666 | 0.680 | 0.832 |
| 1990 | 0.902 | 0.683 | 0.659 | 0.632 | 0.606 | 0.543 | 0.566 | 0.795 | 1.018 | 1.169 | 1.077 | 0.932 |
| 1991 | 0.892 | 0.785 | 0.688 | 0.647 | 0.615 | 0.595 | 0.632 | 0.676 | 0.692 | 0.735 | 0.743 | 0.630 |
| 1992 | 0.591 | 0.616 | 0.591 | 0.618 | 0.631 | 0.668 | 0.673 | 0.648 | 0.679 | 0.699 | 0.641 | 0.624 |
| 1993 | 0.616 | 0.638 | 0.665 | 0.636 | 0.615 | 0.573 | 0.546 | 0.567 | 0.595 | 0.646 | 0.616 | 0.544 |
| 1994 | 0.703 | 0.798 | 0.631 | 0.563 | 0.562 | 0.549 | 0.568 | 0.549 | 0.543 | 0.577 | 0.593 | 0.574 |
| 1995 | 0.562 | 0.542 | 0.504 | 0.548 | 0.562 | 0.530 | 0.515 | 0.541 | 0.573 | 0.562 | 0.588 | 0.646 |
| 1996 | 0.666 | 0.651 | 0.687 | 0.771 | 0.661 | 0.604 | 0.600 | 0.653 | 0.760 | 0.801 | 0.787 | 0.797 |
| 1997 | 0.781 | 0.727 | 0.620 | 0.609 | 0.609 | 0.586 | 0.569 | 0.622 | 0.604 | 0.624 | 0.617 | 0.590 |
| 1998 | 0.552 | 0.519 | 0.477 | 0.473 | 0.457 | 0.439 | 0.421 | 0.417 | 0.472 | 0.473 | 0.455 | 0.388 |
| 1999 | 0.410 | 0.380 | 0.434 | 0.476 | 0.438 | 0.448 | 0.555 | 0.610 | 0.661 | 0.644 | 0.711 | 0.780 |
| 2000 | 1.065 | 1.095 | 0.871 | 0.788 | 0.807 | 0.816 | 0.845 | 0.929 | 1.095 | 1.085 | 1.129 | 1.059 |
| 2001 | 1.032 | 0.942 | 0.855 | 0.853 | 0.887 | 0.847 | 0.764 | 0.837 | NA | 0.746 | 0.653 | 0.627 |
| 2002 | 0.633 | 0.641 | 0.716 | 0.746 | 0.756 | 0.726 | 0.759 | 0.794 | 0.862 | 0.882 | 0.823 | 0.901 |
| 2003 | 0.994 | 1.216 | 1.250 | 0.883 | 0.842 | 0.823 | 0.872 | 0.883 | 0.830 | 0.933 | 0.910 | 0.972 |
| 2004 | 1.127 | 1.178 | 1.075 | 1.060 | 1.218 | 1.108 | 1.224 | 1.328 | 1.442 | 1.675 | 1.514 | 1.435 |
| 2005 | 1.488 | 1.469 | 1.648 | 1.645 | 1.531 | 1.739 | 1.764 | 1.959 | 2.217 | 2.200 | 1.901 | 1.970 |
| 2006 | 1.976 | 1.846 | 1.973 | 2.178 | W | 2.185 | 2.284 | 2.329 | 2.037 | 1.935 | 1.925 | 1.964 |
| 2007 | 1.804 | 1.907 | 1.994 | 2.134 | 2.156 | 2.172 | 2.280 | 2.210 | 2.413 | 2.525 | 2.832 | 2.803 |
| 2008 | 2.808 | 2.824 | 3.271 | 3.571 | 3.771 | 3.970 | NA | 3.447 | NA | 2.590 | 2.179 | 1.688 |
| 2009 | 1.740 | 1.563 | 1.515 | 1.591 | 1.590 | 1.870 | 1.798 | 2.027 | 1.934 | 2.103 | 2.057 | 2.168 |
| 2010 | 2.291 | 2.197 | 2.283 | 2.385 | 2.191 | 2.210 | W | 2.182 | 2.217 | 2.382 | 2.475 | 2.671 |
| 2011 | 2.883 | 3.060 | 3.379 | 3.382 | 3.330 | 3.032 | 3.196 | 3.152 | 3.152 | 3.205 | 3.284 | 3.178 |
| 2012 | 3.297 | 3.399 | 3.449 | 3.410 | 3.133 | 2.949 | 3.089 | 3.262 | 3.359 | 3.376 | 3.313 | 3.293 |
| 2013 | 3.390 | 3.557 | 3.287 | 2.936 | 2.952 | 2.985 | 3.173 | 3.096 | 3.146 | 3.140 | 3.055 | 3.265 |
| 2014 | 3.301 | 3.380 | 3.258 | 3.165 | 3.177 | W | 3.058 | W | 2.892 | 2.750 | 2.663 | 2.327 |
| 2015 | 1.949 | 2.211 | 2.186 | 1.925 | 2.222 | 2.022 | 1.948 | W | 1.635 | 1.654 | 1.617 | 1.336 |
| 2016 | 1.191 | 1.192 | 1.419 | W | W | 1.589 | W | 1.486 | W | 1.656 | 1.579 | 1.700 |
| 2017 | 1.768 | 1.726 | 1.711 | 1.711 | 1.618 | W | 1.750 | 1.708 | 2.015 | 1.832 | 2.062 | 2.153 |
| 2018 | 2.309 | 2.212 | 2.138 | 2.243 | W | W | 2.184 | 2.402 | 2.314 | 2.442 | 2.285 | 1.954 |
| 2019 | 2.060 | 2.122 | 2.180 | 2.201 | 2.112 | 1.974 | 1.982 | 2.132 | 2.047 | 2.040 | 2.077 | 2.101 |
| 2020 | 2.058 | 1.791 | 1.128 | 1.167 | 0.937 | W | W | 1.292 | 1.185 | 1.228 | 1.317 | 1.600 |
| 2021 | 1.737 | 1.876 | 1.922 | 2.055 | 2.237 | 2.092 | W | W | 2.106 | 2.447 | 2.432 | 2.334 |
| 2022 | 2.599 | 3.080 | 3.664 | |||||||||
| - = No Data Reported; -- = Not Applicable; NA = Not Available; W = Withheld to avoid disclosure of individual company data. |
| Release Date: 6/1/2022 |
| Next Release Date: TBD |