|
Download Data (XLS File) |
|
||||||||
|
||||||||
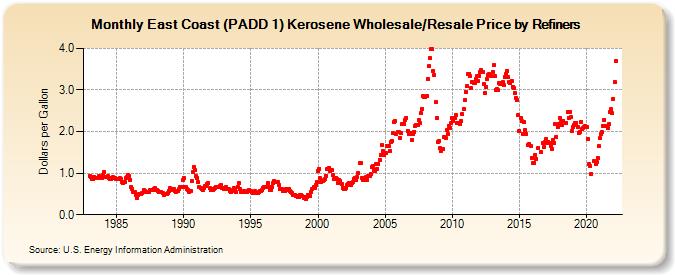
| East Coast (PADD 1) Kerosene Wholesale/Resale Price by Refiners (Dollars per Gallon) | ||||||||
| Year | Jan | Feb | Mar | Apr | May | Jun | Jul | Aug | Sep | Oct | Nov | Dec |
|---|---|---|---|---|---|---|---|---|---|---|---|---|
| 1983 | 0.940 | 0.906 | 0.854 | 0.853 | 0.915 | 0.884 | 0.893 | 0.891 | 0.920 | 0.908 | 0.902 | 0.887 |
| 1984 | 0.967 | 1.025 | 0.915 | 0.915 | 0.921 | 0.887 | 0.866 | 0.851 | 0.882 | 0.896 | 0.877 | 0.861 |
| 1985 | 0.853 | 0.869 | 0.867 | 0.874 | 0.854 | 0.778 | 0.755 | 0.790 | 0.872 | 0.910 | 0.949 | 0.927 |
| 1986 | 0.837 | 0.665 | 0.621 | 0.543 | 0.538 | 0.480 | 0.413 | 0.484 | 0.495 | 0.490 | 0.507 | 0.528 |
| 1987 | 0.591 | 0.563 | 0.539 | 0.544 | 0.555 | 0.555 | 0.587 | 0.597 | 0.583 | 0.625 | 0.634 | 0.600 |
| 1988 | 0.597 | 0.574 | 0.545 | 0.555 | 0.549 | 0.515 | 0.486 | 0.500 | 0.496 | 0.491 | 0.524 | 0.577 |
| 1989 | 0.633 | 0.593 | 0.609 | 0.610 | 0.567 | 0.543 | 0.562 | 0.575 | 0.627 | 0.670 | 0.677 | 0.827 |
| 1990 | 0.891 | 0.678 | 0.657 | 0.630 | 0.602 | 0.544 | 0.577 | 0.814 | 1.017 | 1.153 | 1.066 | 0.938 |
| 1991 | 0.892 | 0.775 | 0.676 | 0.647 | 0.621 | 0.603 | 0.643 | 0.685 | 0.699 | 0.742 | 0.754 | 0.634 |
| 1992 | 0.606 | 0.628 | 0.602 | 0.626 | 0.638 | 0.676 | 0.677 | 0.659 | 0.692 | 0.714 | 0.652 | 0.635 |
| 1993 | 0.621 | 0.641 | 0.662 | 0.630 | 0.614 | 0.578 | 0.551 | 0.574 | 0.598 | 0.645 | 0.617 | 0.535 |
| 1994 | 0.672 | 0.751 | 0.610 | 0.557 | 0.549 | 0.550 | 0.567 | 0.553 | 0.551 | 0.580 | 0.595 | 0.568 |
| 1995 | 0.560 | 0.545 | 0.512 | 0.548 | 0.563 | 0.531 | 0.516 | 0.544 | 0.572 | 0.561 | 0.590 | 0.642 |
| 1996 | 0.663 | 0.658 | 0.675 | 0.751 | 0.662 | 0.602 | 0.606 | 0.664 | 0.752 | 0.809 | 0.788 | 0.790 |
| 1997 | 0.778 | 0.726 | 0.623 | 0.610 | 0.610 | 0.582 | 0.571 | 0.618 | 0.605 | 0.629 | 0.622 | 0.572 |
| 1998 | 0.539 | 0.520 | 0.480 | 0.477 | 0.461 | 0.441 | 0.425 | 0.421 | 0.476 | 0.480 | 0.455 | 0.395 |
| 1999 | 0.423 | 0.385 | 0.437 | 0.481 | 0.442 | 0.454 | 0.556 | 0.610 | 0.664 | 0.649 | 0.717 | 0.778 |
| 2000 | 1.040 | 1.106 | 0.875 | 0.793 | 0.811 | 0.823 | 0.850 | 0.939 | 1.092 | 1.098 | 1.134 | 1.061 |
| 2001 | 1.081 | 0.949 | 0.851 | 0.854 | 0.888 | 0.847 | 0.767 | 0.829 | 0.807 | 0.743 | 0.644 | 0.615 |
| 2002 | 0.628 | 0.633 | 0.705 | 0.745 | 0.753 | 0.724 | 0.759 | 0.794 | 0.866 | 0.889 | 0.831 | 0.901 |
| 2003 | 1.000 | 1.234 | 1.243 | 0.888 | 0.840 | 0.824 | 0.871 | 0.895 | 0.845 | 0.943 | 0.920 | 0.980 |
| 2004 | 1.143 | 1.183 | 1.085 | 1.061 | 1.216 | 1.109 | 1.220 | 1.325 | 1.432 | 1.678 | 1.523 | 1.432 |
| 2005 | 1.484 | 1.475 | 1.661 | 1.653 | 1.534 | 1.741 | 1.765 | 1.964 | 2.229 | 2.247 | 1.943 | 1.987 |
| 2006 | 1.983 | 1.853 | 1.975 | 2.178 | NA | 2.188 | 2.287 | 2.336 | 2.024 | 1.946 | 1.937 | 1.969 |
| 2007 | 1.806 | 1.939 | 1.997 | 2.140 | 2.160 | 2.166 | 2.279 | 2.212 | 2.438 | 2.545 | 2.849 | 2.822 |
| 2008 | 2.835 | 2.849 | 3.275 | 3.565 | 3.763 | 3.976 | 3.983 | 3.462 | 3.366 | 2.703 | 2.329 | 1.755 |
| 2009 | 1.771 | 1.596 | 1.535 | 1.584 | 1.592 | 1.873 | 1.843 | 2.028 | 1.946 | 2.141 | 2.092 | 2.198 |
| 2010 | 2.336 | 2.257 | 2.321 | 2.398 | 2.209 | 2.213 | W | 2.192 | 2.248 | 2.424 | 2.541 | 2.748 |
| 2011 | 2.961 | 3.097 | 3.374 | 3.395 | 3.336 | 3.039 | 3.199 | 3.171 | 3.168 | 3.258 | 3.328 | 3.218 |
| 2012 | 3.339 | 3.435 | 3.469 | 3.426 | 3.138 | 2.931 | 3.082 | 3.266 | 3.366 | 3.389 | 3.357 | 3.334 |
| 2013 | 3.427 | 3.599 | 3.325 | 3.008 | 3.018 | 2.989 | 3.173 | 3.132 | 3.172 | 3.182 | 3.112 | 3.313 |
| 2014 | 3.396 | 3.459 | 3.302 | 3.183 | 3.167 | 3.217 | 3.081 | 3.041 | 2.924 | 2.815 | 2.749 | 2.392 |
| 2015 | 2.025 | 2.332 | 2.244 | 1.943 | 2.222 | 2.035 | 1.947 | W | 1.670 | 1.703 | 1.655 | 1.372 |
| 2016 | 1.244 | 1.252 | 1.438 | 1.349 | W | 1.597 | W | 1.499 | W | 1.723 | 1.634 | 1.760 |
| 2017 | 1.819 | 1.732 | 1.750 | 1.725 | 1.649 | 1.589 | 1.786 | 1.733 | 2.175 | 1.878 | 2.110 | 2.188 |
| 2018 | 2.328 | 2.225 | 2.156 | 2.264 | W | W | 2.205 | 2.470 | 2.328 | 2.482 | 2.349 | 2.018 |
| 2019 | 2.105 | 2.149 | 2.213 | 2.211 | 2.118 | 1.977 | 1.988 | 2.231 | 2.060 | 2.082 | 2.119 | 2.122 |
| 2020 | 2.111 | 1.829 | 1.219 | 1.172 | 0.981 | W | W | 1.302 | 1.220 | 1.263 | 1.366 | 1.644 |
| 2021 | 1.839 | 1.939 | 1.979 | 2.136 | 2.285 | 2.130 | W | 2.081 | 2.172 | 2.482 | 2.533 | 2.437 |
| 2022 | 2.794 | 3.189 | 3.692 | |||||||||
| - = No Data Reported; -- = Not Applicable; NA = Not Available; W = Withheld to avoid disclosure of individual company data. |
| Release Date: 6/1/2022 |
| Next Release Date: TBD |