|
Download Data (XLS File) |
|
||||||||
|
||||||||
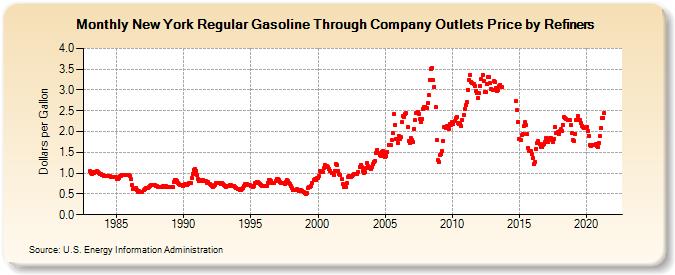
| New York Regular Gasoline Through Company Outlets Price by Refiners (Dollars per Gallon) | ||||||||
| Year | Jan | Feb | Mar | Apr | May | Jun | Jul | Aug | Sep | Oct | Nov | Dec |
|---|---|---|---|---|---|---|---|---|---|---|---|---|
| 1983 | 1.043 | 1.000 | 0.975 | 1.018 | 1.014 | 1.016 | 1.044 | 1.037 | 1.010 | 0.981 | 0.974 | 0.960 |
| 1984 | 0.951 | 0.935 | 0.930 | 0.935 | 0.938 | 0.937 | 0.924 | 0.912 | 0.913 | 0.910 | 0.907 | 0.896 |
| 1985 | 0.870 | 0.867 | 0.892 | 0.927 | 0.940 | 0.959 | 0.965 | 0.967 | 0.952 | 0.948 | 0.945 | 0.944 |
| 1986 | 0.932 | 0.857 | 0.712 | 0.609 | 0.628 | 0.638 | 0.599 | 0.544 | 0.561 | 0.549 | 0.542 | 0.547 |
| 1987 | 0.593 | 0.621 | 0.633 | 0.644 | 0.654 | 0.675 | 0.695 | 0.720 | 0.716 | 0.710 | 0.705 | 0.694 |
| 1988 | 0.694 | 0.676 | 0.662 | 0.658 | 0.664 | 0.686 | 0.675 | 0.689 | 0.686 | 0.677 | 0.675 | 0.675 |
| 1989 | 0.671 | 0.664 | 0.663 | 0.786 | 0.843 | 0.844 | 0.810 | 0.764 | 0.731 | 0.723 | 0.703 | 0.700 |
| 1990 | 0.725 | 0.734 | 0.715 | 0.715 | 0.731 | 0.758 | 0.759 | 0.871 | 0.991 | 1.086 | 1.100 | 1.059 |
| 1991 | 0.961 | 0.863 | 0.812 | 0.817 | 0.837 | 0.834 | 0.814 | 0.806 | 0.804 | 0.774 | 0.781 | 0.746 |
| 1992 | 0.724 | 0.696 | 0.678 | 0.680 | 0.716 | 0.760 | 0.772 | 0.758 | 0.752 | 0.746 | 0.758 | 0.740 |
| 1993 | 0.711 | 0.692 | 0.678 | 0.679 | 0.702 | 0.706 | 0.704 | 0.696 | 0.684 | 0.693 | 0.666 | 0.640 |
| 1994 | 0.616 | 0.614 | 0.604 | 0.604 | 0.619 | 0.645 | 0.686 | 0.728 | 0.730 | 0.723 | 0.721 | 0.716 |
| 1995 | 0.691 | 0.680 | 0.671 | 0.689 | 0.754 | 0.791 | 0.785 | 0.758 | 0.741 | 0.718 | 0.689 | 0.686 |
| 1996 | 0.689 | 0.683 | 0.699 | 0.773 | 0.837 | 0.832 | 0.800 | 0.766 | 0.763 | 0.772 | 0.821 | 0.857 |
| 1997 | 0.856 | 0.839 | 0.798 | 0.770 | 0.758 | 0.769 | 0.745 | 0.796 | 0.834 | 0.800 | 0.767 | 0.736 |
| 1998 | 0.696 | 0.638 | 0.586 | 0.597 | 0.606 | 0.610 | 0.600 | 0.581 | 0.570 | 0.584 | 0.576 | 0.537 |
| 1999 | 0.515 | 0.487 | 0.522 | 0.646 | 0.675 | 0.666 | 0.699 | 0.773 | 0.824 | 0.852 | 0.844 | 0.873 |
| 2000 | 0.886 | 0.921 | 1.056 | 1.028 | 1.019 | 1.117 | 1.196 | 1.137 | 1.161 | 1.147 | 1.089 | 1.052 |
| 2001 | 1.011 | 1.005 | 0.967 | 1.061 | 1.220 | 1.184 | 1.047 | 0.971 | 0.960 | 0.853 | 0.740 | 0.659 |
| 2002 | 0.656 | 0.659 | 0.760 | 0.919 | 0.929 | 0.916 | 0.921 | 0.959 | 0.968 | 0.984 | 0.991 | 0.990 |
| 2003 | 1.038 | 1.152 | 1.197 | 1.144 | 1.061 | 1.007 | 1.021 | 1.126 | 1.243 | 1.165 | 1.112 | 1.092 |
| 2004 | 1.147 | 1.213 | 1.277 | 1.302 | 1.492 | 1.558 | 1.483 | 1.436 | 1.415 | 1.520 | 1.529 | 1.448 |
| 2005 | 1.380 | 1.415 | 1.518 | 1.686 | 1.676 | 1.665 | 1.796 | 1.958 | 2.417 | 2.167 | 1.816 | 1.729 |
| 2006 | 1.889 | 1.831 | 1.865 | 2.224 | 2.380 | 2.351 | 2.432 | 2.438 | 2.104 | 1.781 | 1.727 | 1.833 |
| 2007 | 1.797 | 1.749 | 2.063 | 2.271 | 2.453 | 2.476 | 2.434 | 2.299 | 2.236 | 2.299 | 2.547 | 2.583 |
| 2008 | 2.600 | 2.566 | 2.683 | 2.870 | 3.250 | 3.512 | 3.532 | 3.232 | 3.072 | 2.579 | 1.793 | 1.306 |
| 2009 | 1.262 | 1.429 | 1.452 | 1.536 | 1.775 | 2.106 | 2.075 | 2.134 | 2.108 | 2.072 | 2.185 | 2.160 |
| 2010 | 2.241 | 2.183 | 2.247 | 2.320 | 2.354 | 2.214 | 2.188 | 2.192 | 2.127 | 2.280 | 2.400 | 2.547 |
| 2011 | 2.631 | 2.700 | 3.008 | 3.246 | 3.371 | 3.186 | 3.160 | 3.149 | 3.107 | 2.974 | 2.916 | 2.814 |
| 2012 | 2.916 | 3.103 | 3.268 | 3.361 | 3.204 | 2.956 | 2.945 | 3.152 | 3.323 | 3.301 | 3.161 | 3.030 |
| 2013 | 2.993 | 3.207 | 3.202 | 3.051 | 2.986 | 3.004 | 3.102 | 3.125 | 3.079 | NA | NA | W |
| 2014 | W | W | W | W | W | W | W | W | W | 2.738 | 2.507 | 2.234 |
| 2015 | 1.831 | 1.785 | 1.913 | 1.951 | 2.136 | 2.221 | 2.155 | 1.930 | 1.610 | 1.539 | 1.527 | 1.457 |
| 2016 | 1.354 | 1.211 | 1.272 | 1.583 | 1.729 | 1.764 | 1.699 | 1.625 | 1.635 | 1.685 | 1.700 | 1.753 |
| 2017 | 1.856 | 1.789 | 1.749 | 1.839 | 1.839 | 1.789 | 1.745 | 1.818 | 2.106 | 1.959 | 1.995 | 1.930 |
| 2018 | 2.010 | 2.058 | 2.015 | 2.166 | 2.341 | 2.332 | 2.300 | 2.287 | 2.283 | 2.279 | 2.146 | 1.960 |
| 2019 | 1.802 | 1.783 | 1.951 | 2.284 | 2.373 | 2.269 | 2.289 | 2.217 | 2.140 | 2.105 | 2.092 | 2.088 |
| 2020 | 2.118 | 2.009 | 1.900 | 1.676 | 1.646 | 1.669 | 1.677 | 1.673 | 1.701 | 1.662 | 1.632 | 1.729 |
| 2021 | 1.894 | 2.094 | 2.323 | 2.331 | 2.445 | W | W | W | W | W | W | W |
| 2022 | W | W | W | |||||||||
| - = No Data Reported; -- = Not Applicable; NA = Not Available; W = Withheld to avoid disclosure of individual company data. |
| Release Date: 6/1/2022 |
| Next Release Date: TBD |