|
Download Data (XLS File) |
|
||||||||
|
||||||||
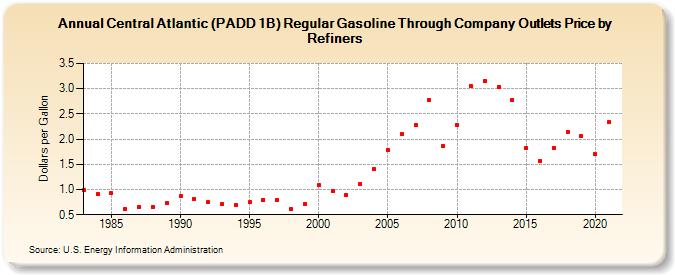
| Central Atlantic (PADD 1B) Regular Gasoline Through Company Outlets Price by Refiners (Dollars per Gallon) | ||||||||
| Decade | Year-0 | Year-1 | Year-2 | Year-3 | Year-4 | Year-5 | Year-6 | Year-7 | Year-8 | Year-9 |
|---|---|---|---|---|---|---|---|---|---|---|
| 1980's | 0.984 | 0.911 | 0.927 | 0.618 | 0.661 | 0.657 | 0.732 | |||
| 1990's | 0.863 | 0.812 | 0.751 | 0.703 | 0.686 | 0.743 | 0.799 | 0.799 | 0.605 | 0.710 |
| 2000's | 1.082 | 0.977 | 0.895 | 1.114 | 1.403 | 1.787 | 2.104 | 2.280 | 2.783 | 1.864 |
| 2010's | 2.287 | 3.051 | 3.159 | 3.036 | 2.776 | 1.821 | 1.571 | 1.830 | 2.150 | 2.058 |
| 2020's | 1.709 |
| - = No Data Reported; -- = Not Applicable; NA = Not Available; W = Withheld to avoid disclosure of individual company data. |
| Release Date: 6/1/2022 |
| Next Release Date: TBD |