|
Download Data (XLS File) |
|
||||||||
|
||||||||
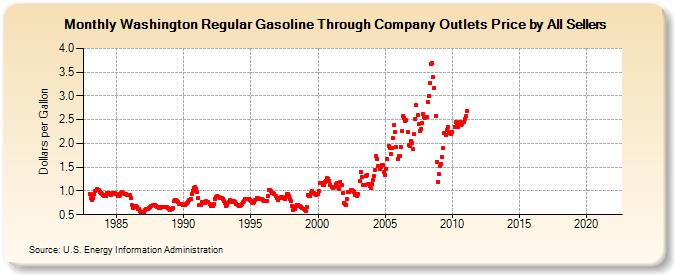
| Washington Regular Gasoline Through Company Outlets Price by All Sellers (Dollars per Gallon) | ||||||||
| Year | Jan | Feb | Mar | Apr | May | Jun | Jul | Aug | Sep | Oct | Nov | Dec |
|---|---|---|---|---|---|---|---|---|---|---|---|---|
| 1983 | 0.942 | 0.853 | 0.806 | 0.854 | 0.930 | 0.993 | 1.033 | 1.028 | 1.020 | 0.984 | 0.949 | 0.930 |
| 1984 | 0.925 | 0.888 | 0.897 | 0.948 | 0.967 | 0.958 | 0.938 | 0.920 | 0.929 | 0.948 | 0.948 | 0.943 |
| 1985 | 0.930 | 0.902 | 0.889 | 0.908 | 0.949 | 0.970 | 0.962 | 0.942 | 0.933 | 0.924 | 0.915 | 0.923 |
| 1986 | 0.910 | 0.856 | 0.694 | 0.641 | 0.667 | 0.681 | 0.663 | 0.626 | 0.618 | 0.579 | 0.542 | 0.539 |
| 1987 | 0.563 | 0.598 | 0.612 | 0.621 | 0.627 | 0.634 | 0.653 | 0.683 | 0.698 | 0.709 | 0.703 | 0.691 |
| 1988 | 0.670 | 0.652 | 0.636 | 0.645 | 0.661 | 0.658 | 0.656 | 0.666 | 0.666 | 0.660 | 0.644 | 0.625 |
| 1989 | 0.607 | 0.616 | 0.649 | 0.790 | 0.816 | 0.806 | 0.796 | 0.758 | 0.722 | 0.733 | 0.715 | 0.696 |
| 1990 | 0.708 | 0.709 | 0.716 | 0.747 | 0.771 | 0.803 | 0.840 | 0.935 | 1.005 | 1.068 | 1.082 | 1.048 |
| 1991 | 0.971 | 0.852 | 0.708 | 0.704 | 0.761 | 0.774 | 0.744 | 0.757 | 0.787 | 0.776 | 0.761 | 0.734 |
| 1992 | 0.692 | 0.681 | 0.682 | 0.722 | 0.823 | 0.870 | 0.895 | 0.883 | 0.861 | 0.861 | 0.859 | 0.826 |
| 1993 | 0.795 | 0.747 | 0.680 | 0.704 | 0.771 | 0.801 | 0.793 | 0.777 | 0.769 | 0.782 | 0.774 | 0.733 |
| 1994 | 0.694 | 0.688 | 0.686 | 0.697 | 0.728 | 0.758 | 0.794 | 0.828 | 0.836 | 0.827 | 0.836 | 0.815 |
| 1995 | 0.794 | 0.776 | 0.750 | 0.762 | 0.817 | 0.843 | 0.844 | 0.827 | 0.821 | 0.824 | 0.823 | 0.811 |
| 1996 | 0.798 | 0.780 | 0.792 | 0.896 | 1.010 | 1.012 | 0.991 | 0.965 | 0.952 | 0.936 | 0.894 | 0.852 |
| 1997 | 0.817 | 0.850 | 0.858 | 0.881 | 0.870 | 0.846 | 0.829 | 0.869 | 0.934 | 0.935 | 0.894 | 0.837 |
| 1998 | 0.779 | 0.678 | 0.608 | 0.625 | 0.688 | 0.706 | 0.702 | 0.689 | 0.677 | 0.662 | 0.636 | 0.624 |
| 1999 | 0.602 | 0.571 | 0.667 | 0.917 | 0.892 | 0.886 | 0.962 | 0.990 | 0.967 | 0.937 | 0.918 | 0.939 |
| 2000 | 0.941 | 0.998 | 1.176 | 1.176 | 1.116 | 1.119 | 1.191 | 1.206 | 1.274 | 1.260 | 1.205 | 1.131 |
| 2001 | 1.076 | 1.067 | 1.090 | 1.093 | 1.136 | 1.168 | 1.085 | 1.038 | 1.196 | 1.117 | 0.950 | 0.753 |
| 2002 | 0.724 | 0.707 | 0.835 | 0.979 | 0.986 | 1.018 | 1.014 | 1.007 | 0.974 | 0.925 | 0.931 | 0.902 |
| 2003 | 0.941 | 1.202 | 1.394 | 1.290 | 1.134 | 1.118 | 1.129 | 1.322 | 1.341 | 1.156 | 1.110 | 1.061 |
| 2004 | 1.141 | 1.235 | 1.317 | 1.445 | 1.728 | 1.674 | 1.525 | 1.472 | 1.509 | 1.551 | 1.544 | 1.406 |
| 2005 | 1.338 | 1.471 | 1.664 | 1.954 | 1.898 | 1.788 | 1.902 | 2.111 | 2.381 | 2.236 | 1.915 | 1.680 |
| 2006 | 1.733 | 1.740 | 1.918 | 2.264 | 2.584 | 2.539 | 2.481 | 2.483 | 2.236 | 1.959 | 1.940 | 2.061 |
| 2007 | 2.006 | 1.876 | 2.191 | 2.521 | 2.805 | 2.592 | 2.404 | 2.262 | 2.313 | 2.432 | 2.628 | 2.564 |
| 2008 | 2.537 | 2.564 | 2.870 | 2.992 | 3.282 | 3.668 | 3.692 | 3.392 | 3.159 | 2.575 | 1.618 | 1.195 |
| 2009 | 1.354 | 1.532 | 1.569 | 1.721 | 1.912 | 2.223 | 2.180 | 2.274 | 2.348 | 2.221 | 2.249 | 2.202 |
| 2010 | 2.238 | NA | 2.353 | 2.445 | 2.415 | 2.338 | 2.384 | 2.454 | 2.380 | 2.403 | 2.445 | 2.515 |
| 2011 | 2.586 | 2.691 | - | - | - | - | - | - | - | - | - | - |
| 2012 | - | - | - | - | - | - | - | - | - | - | - | - |
| 2013 | - | - | - | - | - | - | - | - | - | - | - | - |
| 2014 | - | - | - | - | - | - | - | - | - | - | - | - |
| 2015 | - | - | - | - | - | - | - | - | - | - | - | - |
| 2016 | - | - | - | - | - | - | - | - | - | - | - | - |
| 2017 | - | - | - | - | - | - | - | - | - | - | - | - |
| 2018 | - | - | - | - | - | - | - | - | - | - | - | - |
| 2019 | - | - | - | - | - | - | - | - | - | - | - | - |
| 2020 | - | - | - | - | - | - | - | - | - | - | - | - |
| 2021 | - | - | - | - | - | - | - | - | - | - | - | - |
| 2022 | - | - | - | |||||||||
| - = No Data Reported; -- = Not Applicable; NA = Not Available; W = Withheld to avoid disclosure of individual company data. |
| Release Date: 6/1/2022 |
| Next Release Date: TBD |