|
Download Data (XLS File) |
|
||||||||
|
||||||||
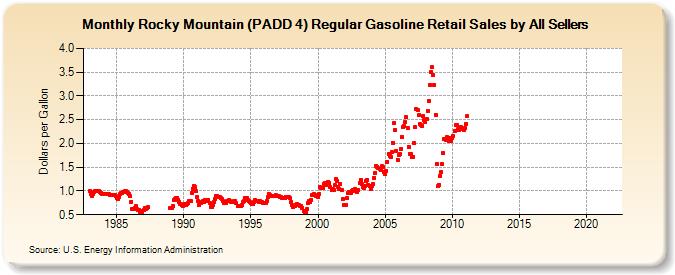
| Rocky Mountain (PADD 4) Regular Gasoline Retail Sales by All Sellers (Dollars per Gallon) | ||||||||
| Year | Jan | Feb | Mar | Apr | May | Jun | Jul | Aug | Sep | Oct | Nov | Dec |
|---|---|---|---|---|---|---|---|---|---|---|---|---|
| 1983 | 0.996 | 0.927 | 0.896 | 0.930 | 0.975 | 1.002 | 0.997 | 1.006 | 0.994 | 0.987 | 0.960 | 0.943 |
| 1984 | 0.932 | 0.938 | 0.946 | 0.943 | 0.936 | 0.930 | 0.925 | 0.924 | 0.924 | 0.915 | 0.910 | 0.886 |
| 1985 | 0.846 | 0.822 | 0.873 | 0.937 | 0.954 | 0.965 | 0.972 | 0.992 | 0.991 | 0.979 | 0.961 | 0.941 |
| 1986 | 0.887 | 0.775 | 0.614 | 0.616 | 0.642 | 0.682 | 0.614 | 0.595 | 0.602 | 0.562 | 0.573 | 0.566 |
| 1987 | 0.598 | 0.637 | 0.629 | 0.647 | 0.654 | |||||||
| 1988 | NA | NA | NA | NA | NA | NA | NA | NA | NA | NA | NA | NA |
| 1989 | 0.632 | 0.648 | 0.679 | 0.807 | 0.841 | 0.846 | 0.861 | 0.810 | 0.773 | 0.731 | 0.701 | 0.689 |
| 1990 | 0.718 | 0.698 | 0.695 | 0.723 | 0.741 | 0.784 | 0.782 | 0.961 | 1.048 | 1.114 | 1.084 | 0.992 |
| 1991 | 0.876 | 0.785 | 0.704 | 0.737 | 0.772 | 0.788 | 0.771 | 0.811 | 0.820 | 0.792 | 0.814 | 0.752 |
| 1992 | 0.666 | 0.668 | 0.712 | 0.768 | 0.828 | 0.884 | 0.891 | 0.880 | 0.867 | 0.843 | 0.837 | 0.781 |
| 1993 | 0.744 | 0.743 | 0.753 | 0.781 | 0.803 | 0.794 | 0.777 | 0.775 | 0.773 | 0.787 | 0.783 | 0.745 |
| 1994 | 0.686 | 0.685 | 0.675 | 0.675 | 0.709 | 0.762 | 0.798 | 0.852 | 0.858 | 0.812 | 0.796 | 0.770 |
| 1995 | 0.749 | 0.731 | 0.734 | 0.764 | 0.805 | 0.799 | 0.786 | 0.771 | 0.782 | 0.766 | 0.758 | 0.744 |
| 1996 | 0.742 | 0.748 | 0.782 | 0.870 | 0.934 | 0.908 | 0.888 | 0.891 | 0.898 | 0.898 | 0.905 | 0.886 |
| 1997 | 0.886 | 0.885 | 0.868 | 0.868 | 0.861 | 0.860 | 0.851 | 0.878 | 0.880 | 0.879 | 0.869 | 0.844 |
| 1998 | 0.778 | 0.699 | 0.654 | 0.678 | 0.713 | 0.727 | 0.709 | 0.697 | 0.687 | 0.681 | 0.651 | 0.570 |
| 1999 | 0.551 | 0.554 | 0.612 | 0.738 | 0.779 | 0.766 | 0.820 | 0.905 | 0.935 | 0.916 | 0.895 | 0.889 |
| 2000 | 0.876 | 0.936 | 1.077 | 1.053 | 1.063 | 1.149 | 1.160 | 1.129 | 1.164 | 1.190 | 1.163 | 1.084 |
| 2001 | 1.023 | 1.036 | 1.018 | 1.120 | 1.255 | 1.217 | 1.080 | 1.043 | 1.152 | 1.025 | 0.830 | 0.703 |
| 2002 | 0.707 | 0.711 | 0.849 | 0.962 | 0.971 | 0.958 | 1.002 | 1.023 | 1.008 | 1.045 | 1.024 | 0.969 |
| 2003 | 1.020 | 1.167 | 1.234 | 1.150 | 1.075 | 1.065 | 1.100 | 1.211 | 1.235 | 1.134 | 1.094 | 1.050 |
| 2004 | 1.094 | 1.152 | 1.281 | 1.381 | 1.531 | 1.510 | 1.474 | 1.462 | 1.448 | 1.518 | 1.509 | 1.401 |
| 2005 | 1.348 | 1.422 | 1.610 | 1.780 | 1.743 | 1.712 | 1.814 | 2.016 | 2.440 | 2.289 | 1.851 | 1.658 |
| 2006 | 1.757 | 1.776 | 1.890 | 2.142 | 2.351 | 2.372 | 2.448 | 2.546 | 2.320 | 1.931 | 1.785 | 1.781 |
| 2007 | 1.719 | 1.721 | 2.006 | 2.336 | 2.723 | 2.707 | 2.593 | 2.415 | 2.378 | 2.372 | 2.577 | 2.489 |
| 2008 | 2.458 | 2.513 | 2.688 | 2.901 | 3.230 | 3.512 | 3.602 | 3.437 | 3.233 | 2.604 | 1.574 | 1.098 |
| 2009 | 1.129 | 1.324 | 1.396 | 1.565 | 1.799 | 2.102 | 2.062 | 2.127 | 2.096 | 2.045 | 2.119 | 2.051 |
| 2010 | 2.124 | 2.152 | 2.266 | 2.393 | 2.396 | 2.295 | 2.282 | 2.322 | 2.336 | 2.300 | 2.290 | 2.317 |
| 2011 | 2.409 | 2.567 | - | - | - | - | - | - | - | - | - | - |
| 2012 | - | - | - | - | - | - | - | - | - | - | - | - |
| 2013 | - | - | - | - | - | - | - | - | - | - | - | - |
| 2014 | - | - | - | - | - | - | - | - | - | - | - | - |
| 2015 | - | - | - | - | - | - | - | - | - | - | - | - |
| 2016 | - | - | - | - | - | - | - | - | - | - | - | - |
| 2017 | - | - | - | - | - | - | - | - | - | - | - | - |
| 2018 | - | - | - | - | - | - | - | - | - | - | - | - |
| 2019 | - | - | - | - | - | - | - | - | - | - | - | - |
| 2020 | - | - | - | - | - | - | - | - | - | - | - | - |
| 2021 | - | - | - | - | - | - | - | - | - | - | - | - |
| 2022 | - | - | - | |||||||||
| - = No Data Reported; -- = Not Applicable; NA = Not Available; W = Withheld to avoid disclosure of individual company data. |
| Release Date: 6/1/2022 |
| Next Release Date: TBD |