|
Download Data (XLS File) |
|
||||||||
|
||||||||
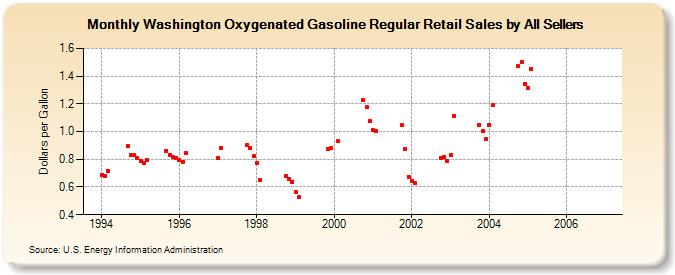
| Washington Oxygenated Gasoline Regular Retail Sales by All Sellers (Dollars per Gallon) | ||||||||
| Year | Jan | Feb | Mar | Apr | May | Jun | Jul | Aug | Sep | Oct | Nov | Dec |
|---|---|---|---|---|---|---|---|---|---|---|---|---|
| 1994 | 0.686 | 0.679 | 0.718 | W | W | W | W | W | 0.893 | 0.834 | 0.828 | 0.807 |
| 1995 | 0.789 | 0.773 | 0.797 | W | W | W | W | W | 0.861 | 0.834 | 0.819 | 0.806 |
| 1996 | 0.796 | 0.783 | 0.846 | W | W | NA | NA | NA | NA | NA | NA | NA |
| 1997 | 0.809 | 0.884 | W | W | W | W | W | W | W | 0.904 | 0.881 | 0.822 |
| 1998 | 0.773 | 0.654 | W | W | W | W | W | W | W | 0.679 | 0.658 | 0.639 |
| 1999 | 0.563 | 0.526 | W | W | W | W | W | W | W | W | 0.876 | 0.879 |
| 2000 | W | 0.930 | W | W | W | W | W | W | W | 1.229 | 1.174 | 1.075 |
| 2001 | 1.009 | 1.001 | W | W | W | W | W | W | W | 1.045 | 0.875 | 0.674 |
| 2002 | 0.642 | 0.630 | W | W | W | W | W | W | W | 0.809 | 0.820 | 0.787 |
| 2003 | 0.831 | 1.111 | W | W | W | W | W | W | W | 1.050 | 1.003 | 0.944 |
| 2004 | 1.046 | 1.190 | W | W | W | W | W | W | W | 1.470 | 1.500 | 1.343 |
| 2005 | 1.315 | 1.449 | NA | - | - | - | - | - | - | - | - | - |
| 2006 | - | - | - | - | - | - | - | - | - | - | - | - |
| - = No Data Reported; -- = Not Applicable; NA = Not Available; W = Withheld to avoid disclosure of individual company data. |
| Release Date: 6/1/2022 |
| Next Release Date: TBD |